Lari Pancieri

Dashboard Design for a Global Financial Platform
Product Design
UX Research
UI Design
Problem Definition 🔍
What are we trying to solve? Partner banks reported that training new employees to use the VisionPLUS platform was too time-consuming and costly. On average, it took six months for a new hire to become fully proficient in the system, delaying operational efficiency and increasing onboarding costs.
Customer Support Cost – Summary
Between january and june 2022, users with less than 6 months of experience made up only 18% of the active user base, yet accounted for 48% of all support tickets. This indicates that new users required significantly more help due to the system’s complexity.
The average time to resolve these tickets was 35% higher than normal, demanding more technical effort.
Key metrics: • Average cost per ticket: $42 • Monthly tickets from these users: 2,100 • Estimated monthly cost: $88,200 • Estimated annual cost: $1.06 million
Investigation 🔍
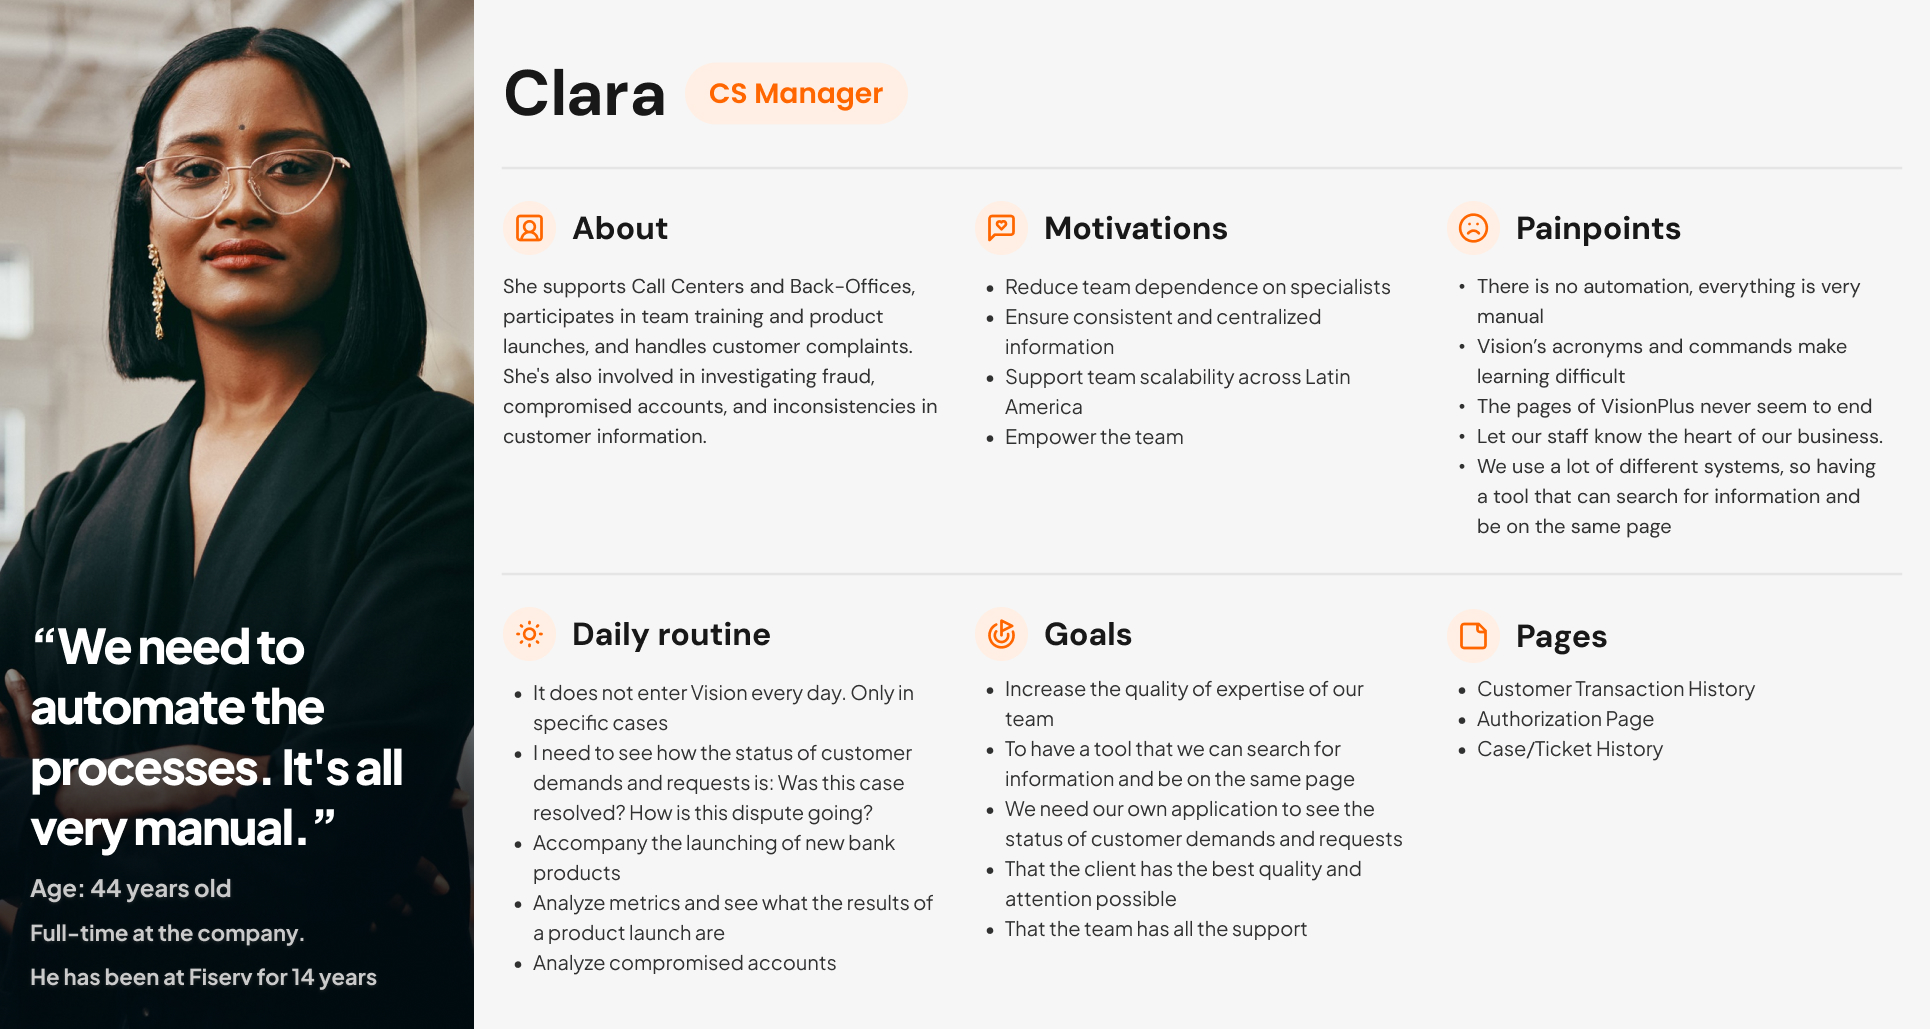
This is the phase of user interviews, data analysis, and persona documentation. It's a crucial step for generating meaningful research insights and results.
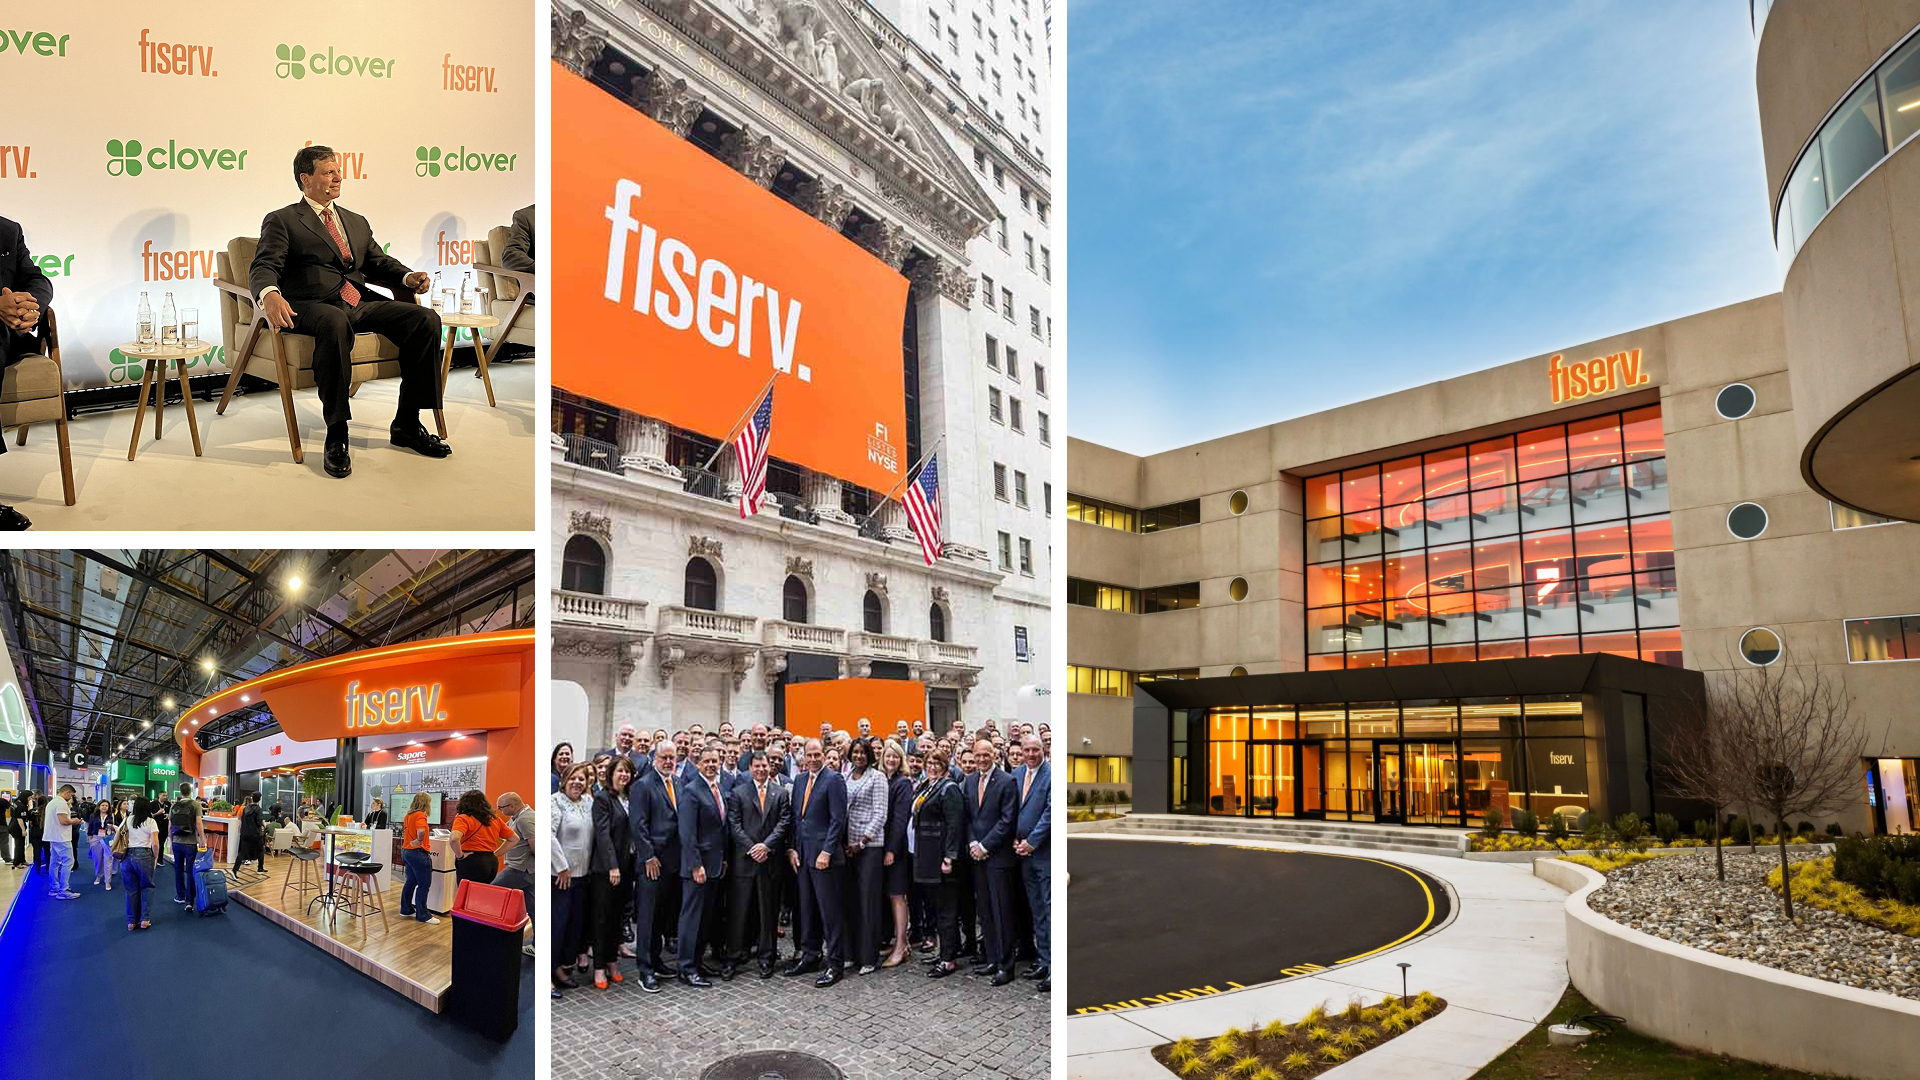
About Fiserv
Fiserv is one of the world’s largest financial technology companies, serving banks, fintechs, and retailers with payment solutions, processing services, and banking technology. Operating in over 100 countries, it processes trillions of dollars in transactions annually.
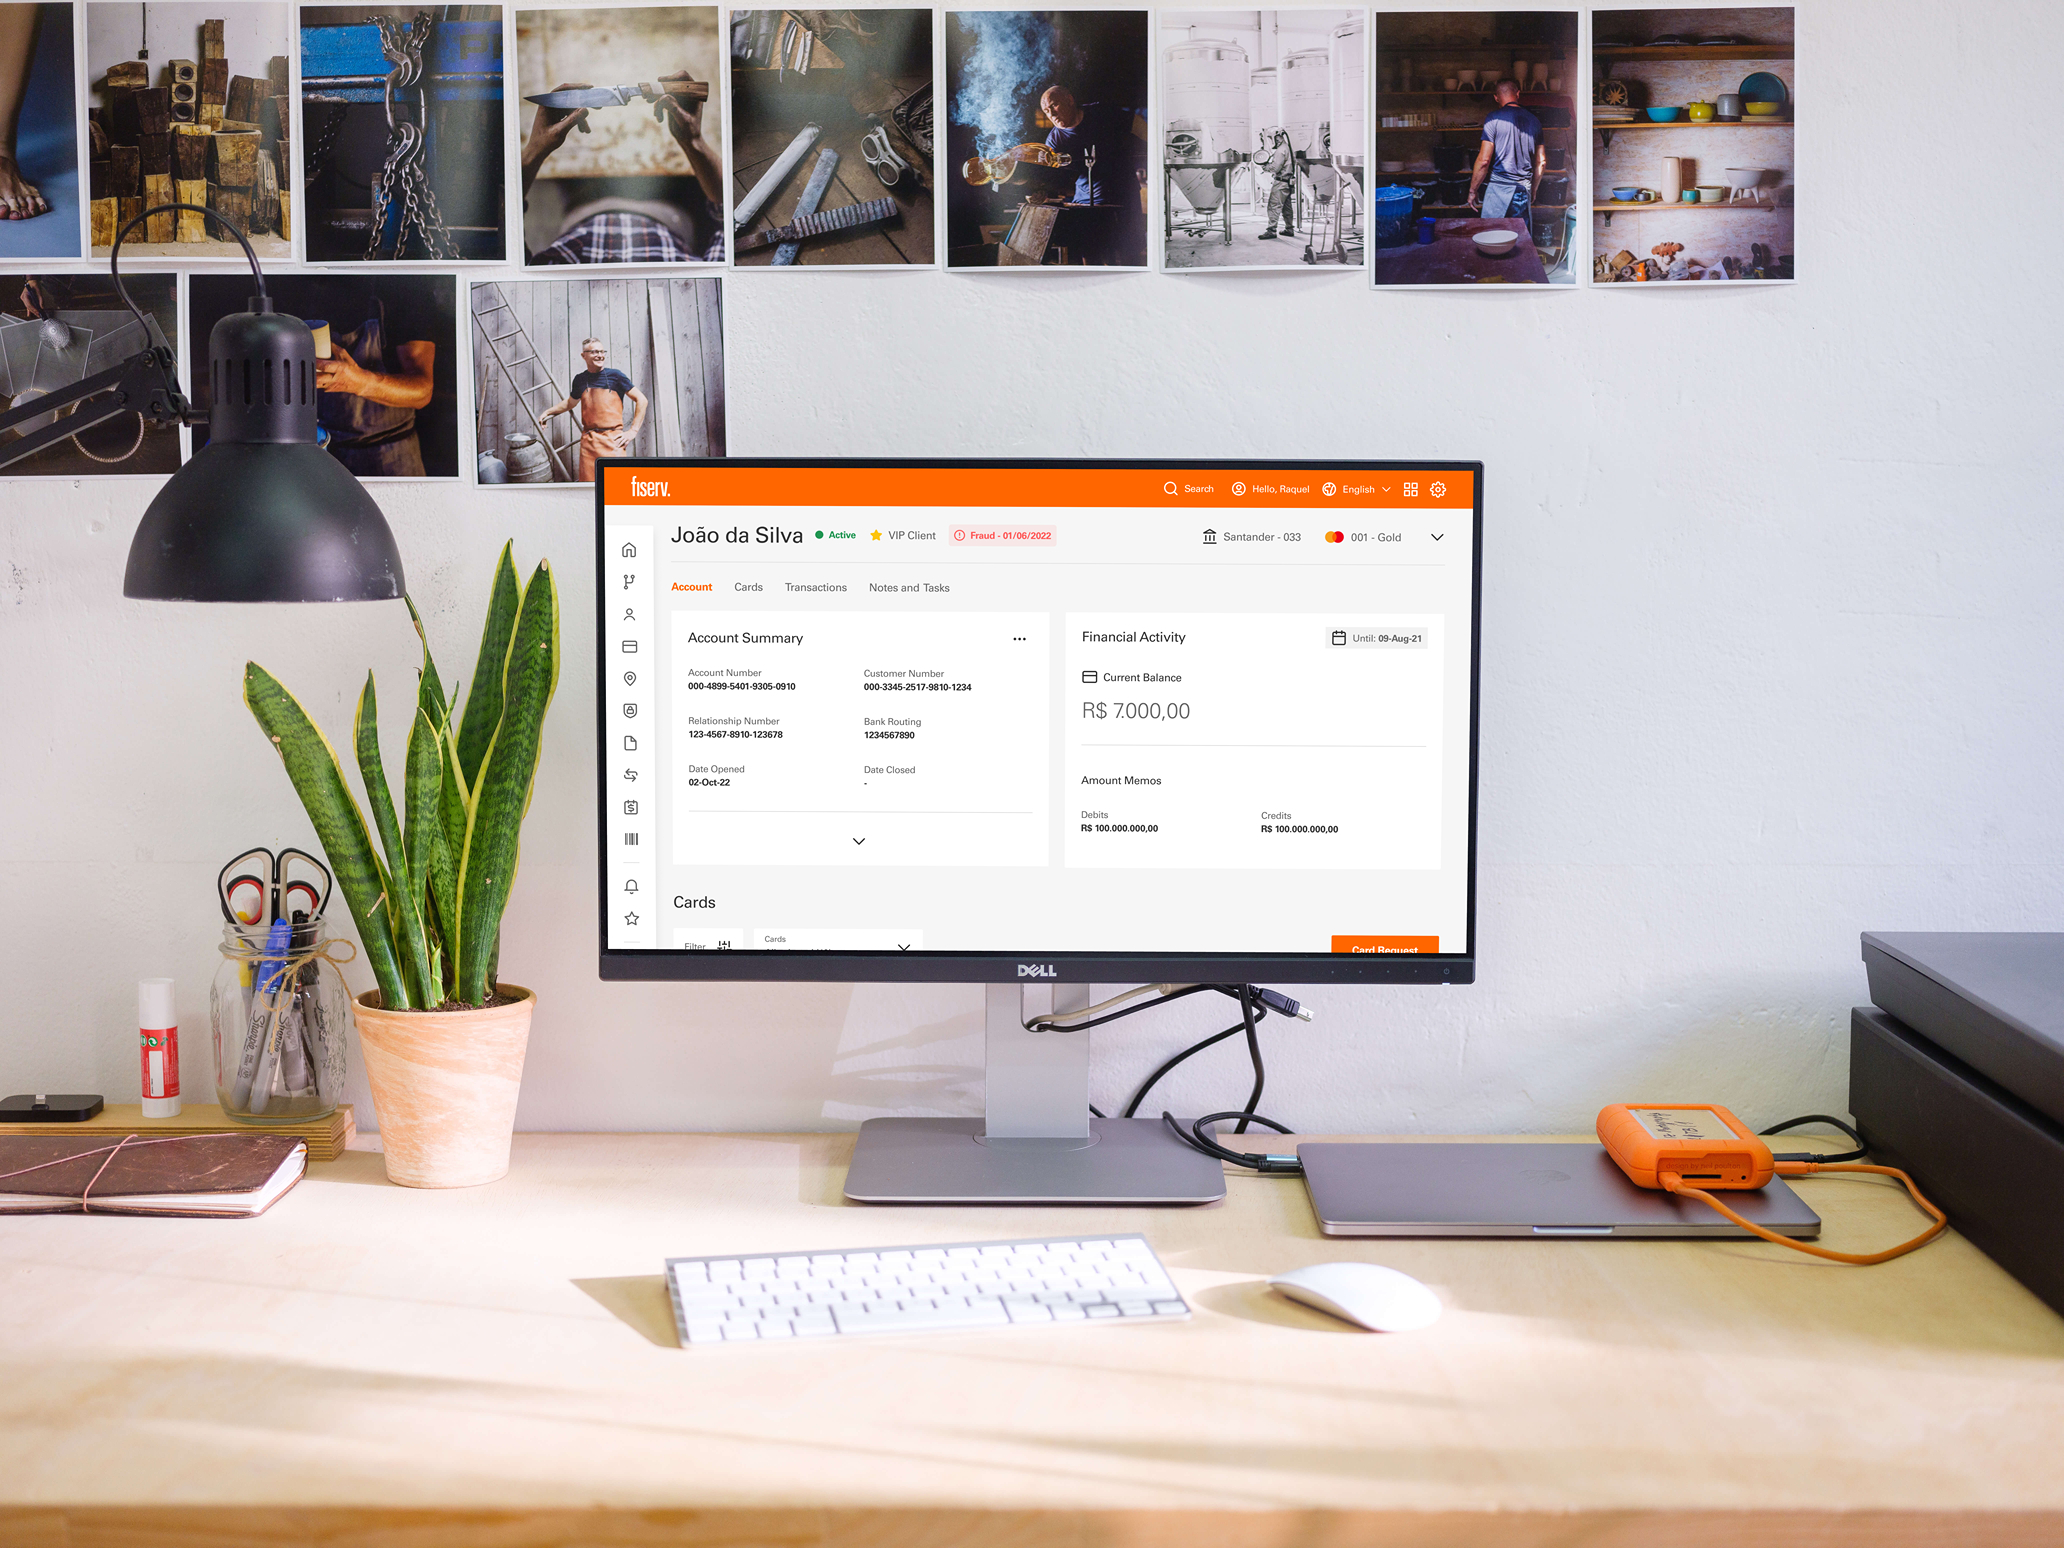
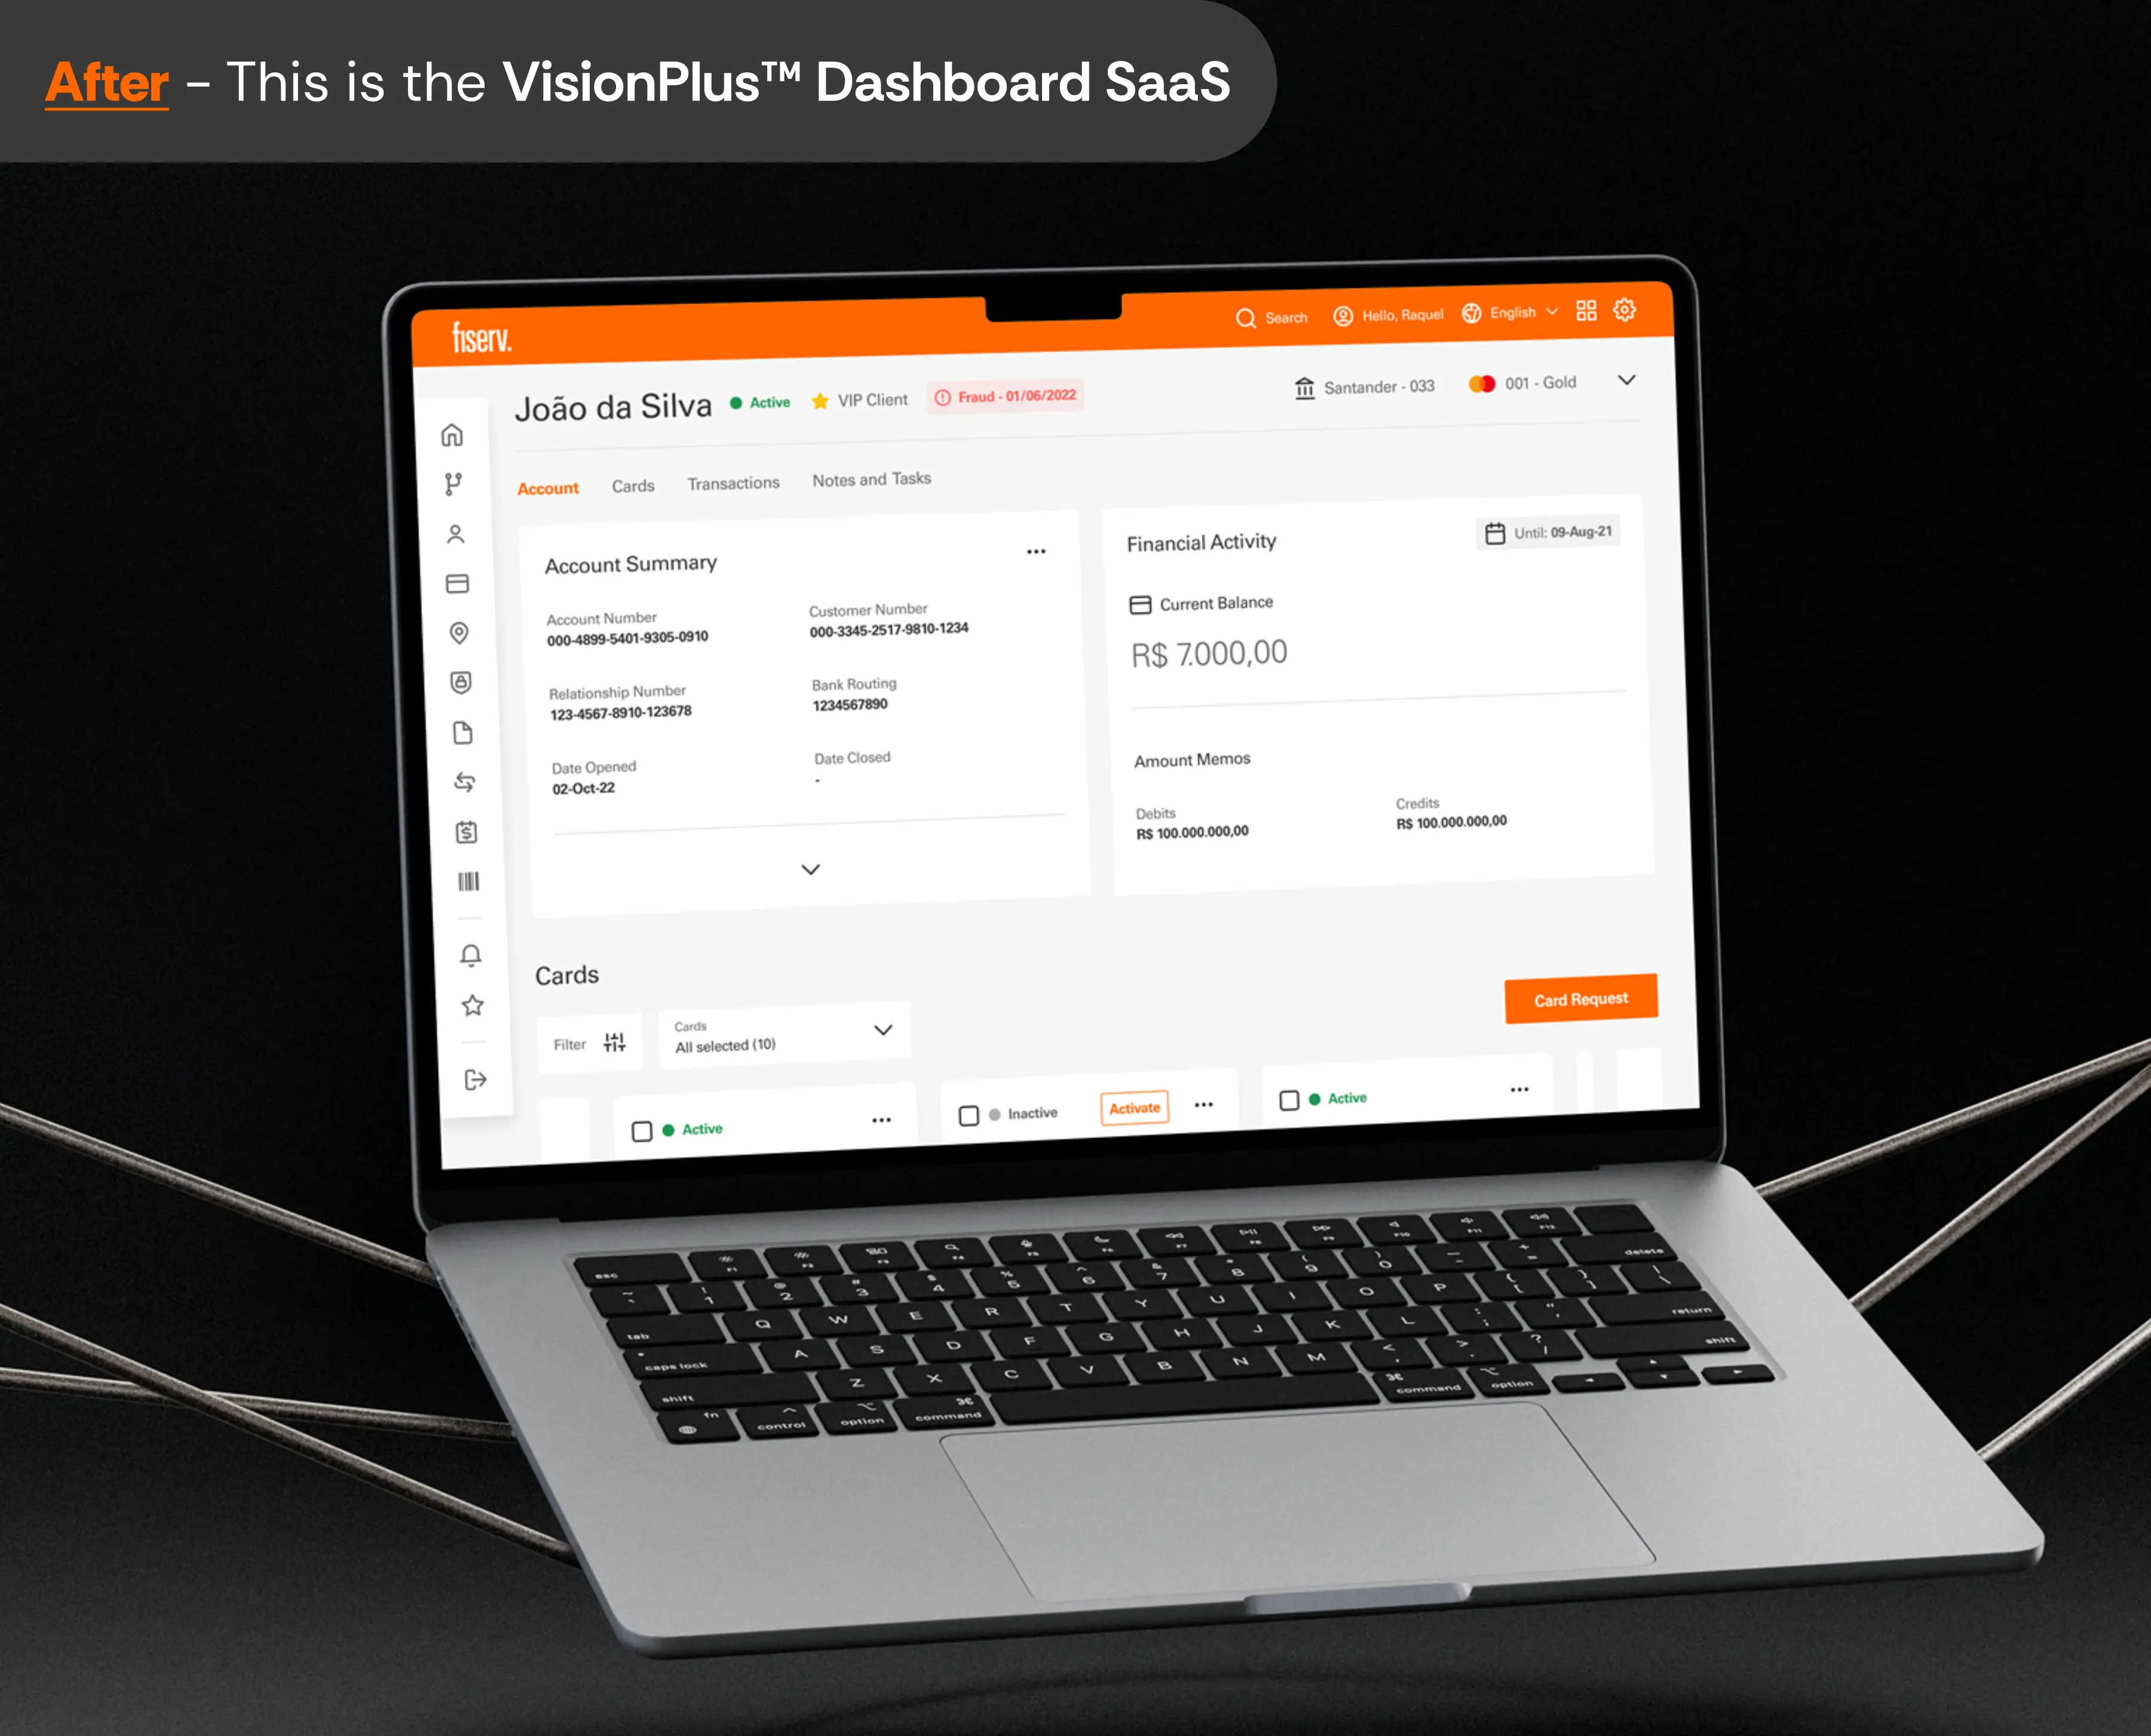
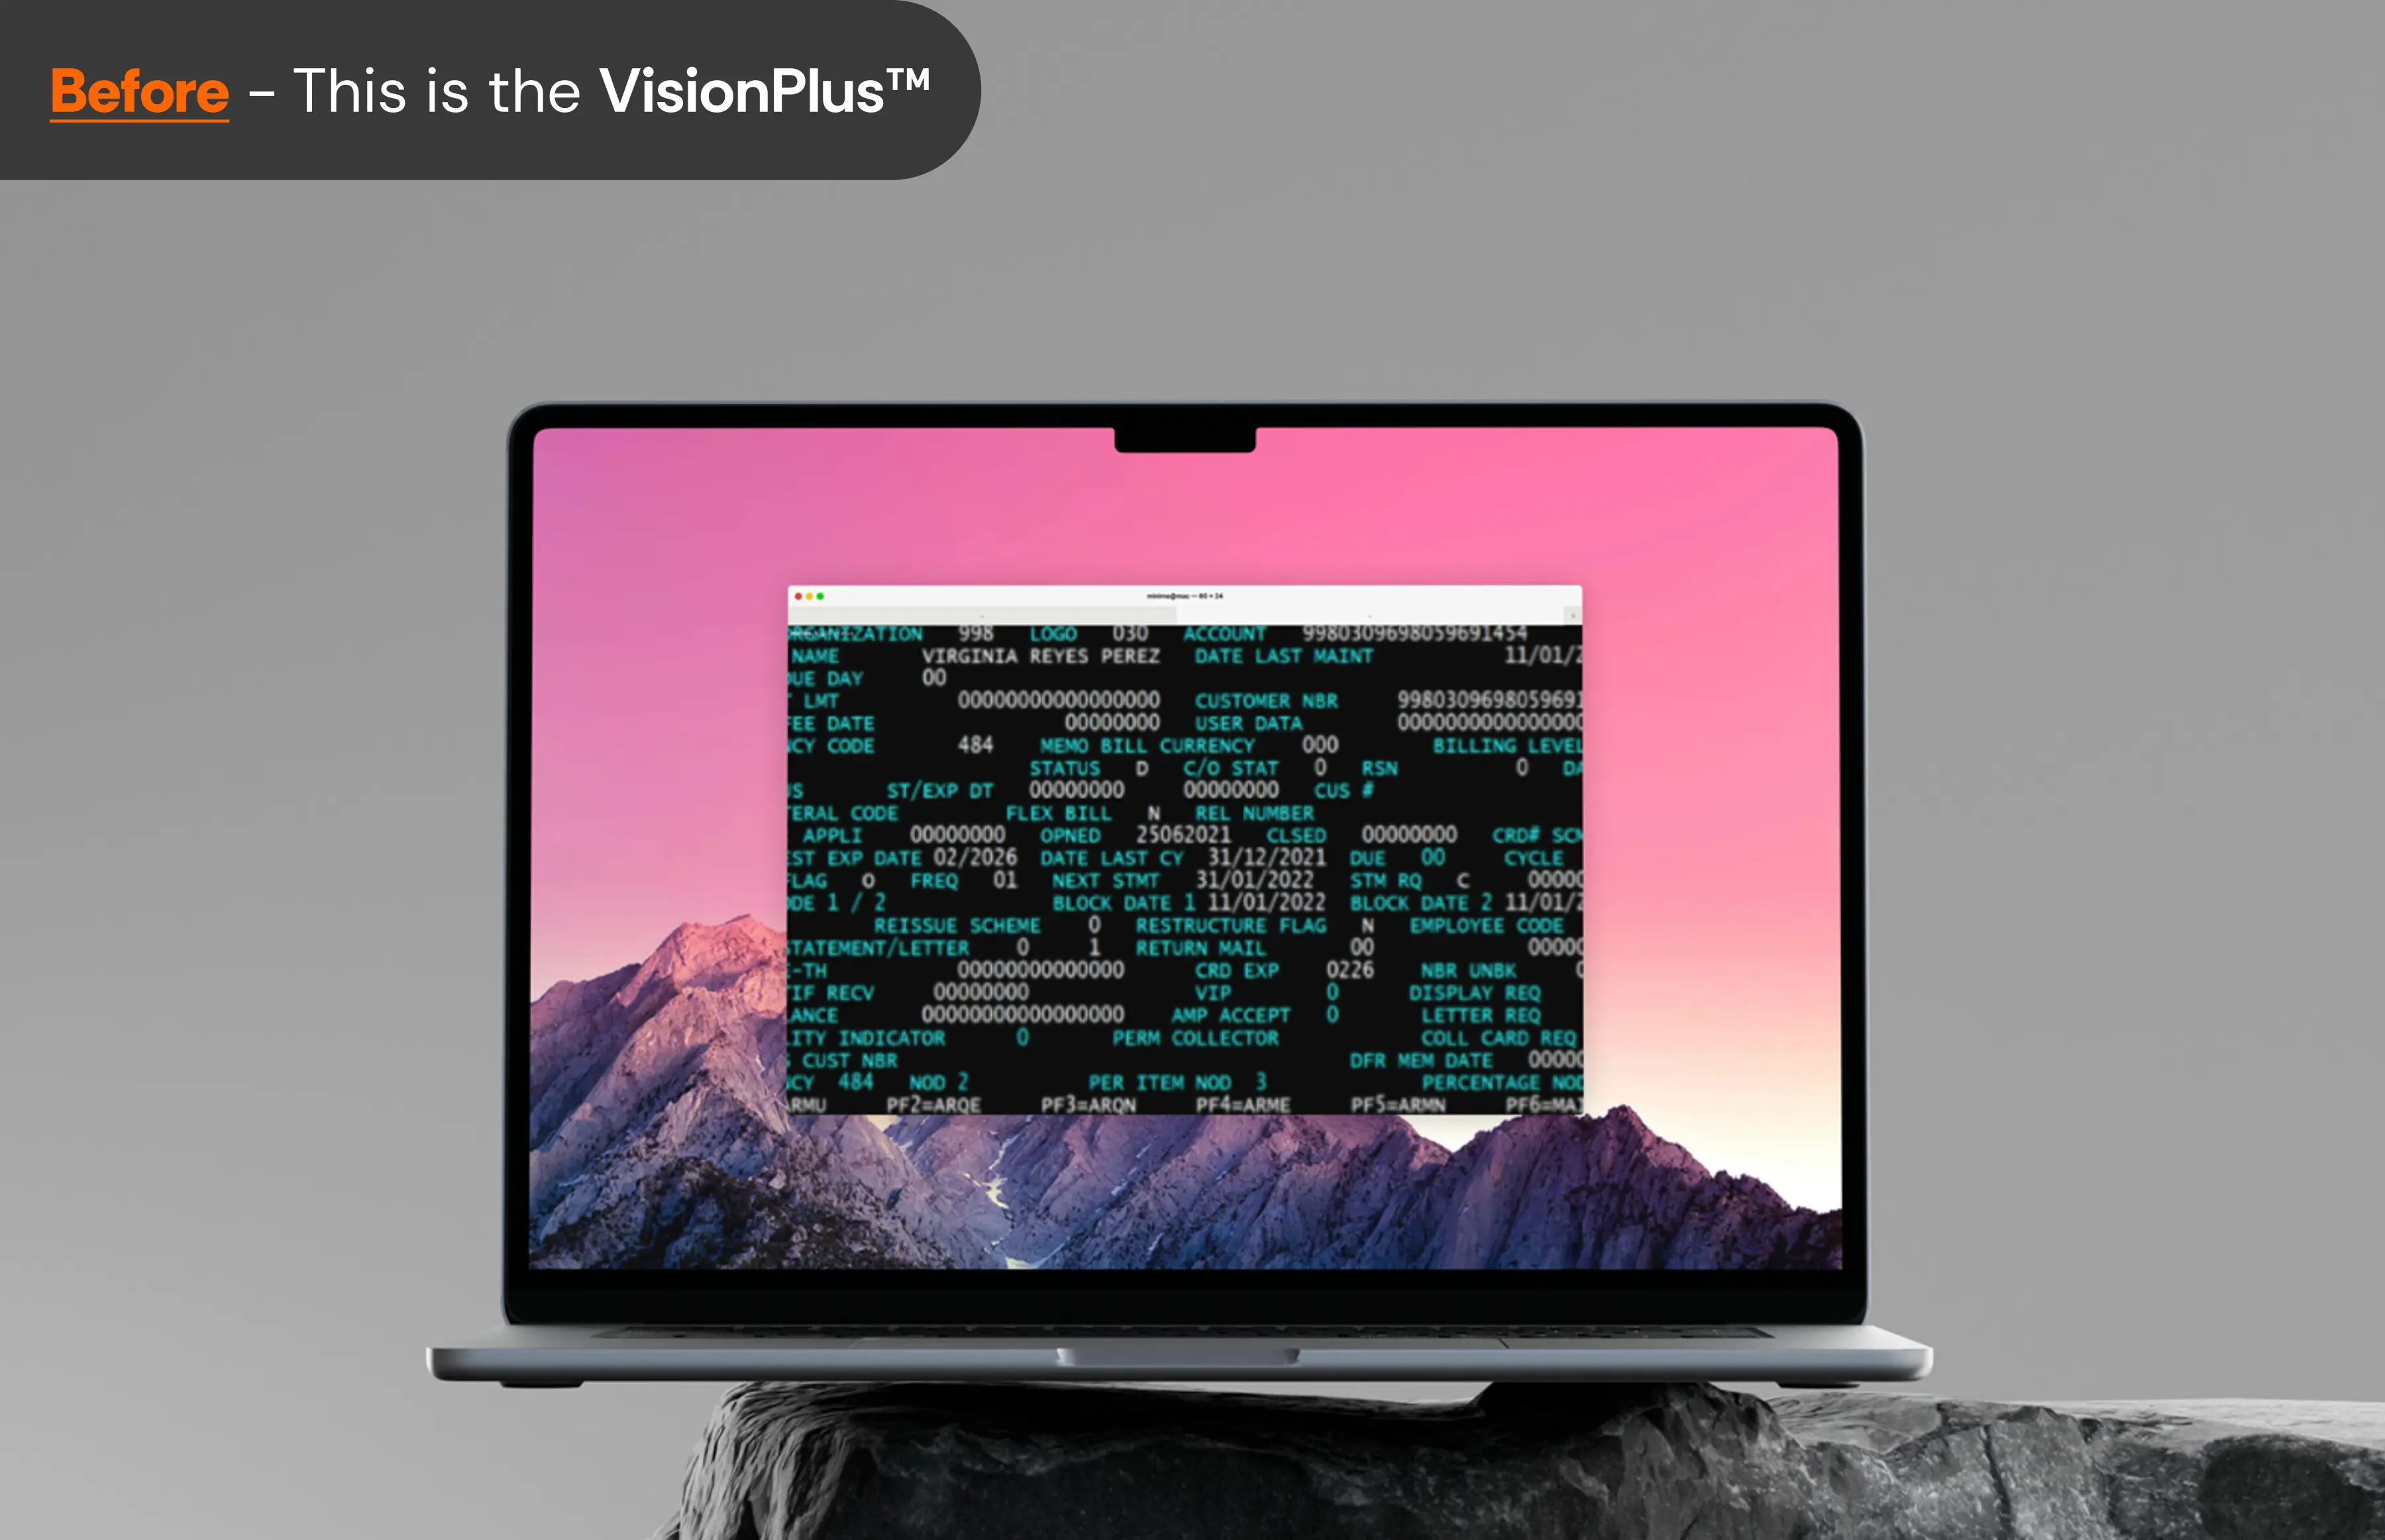
What is the VisionPlus™?
VisionPLUS is a robust card and payment processing platform, used by major banks and financial institutions around the world. It manages the entire lifecycle of financial products such as credit cards, debit cards, loans, and financing, offering high scalability, security, and performance.
Who are the users?
- Fintechs
- Bank representative
- Bank employees
Task: I suggested starting with a qualitative research phase. My role would be to interview the different user profiles of VisionPlus to understand their daily routines, goals, and specific needs. I would also map each group's journey within the terminal and their task flows.
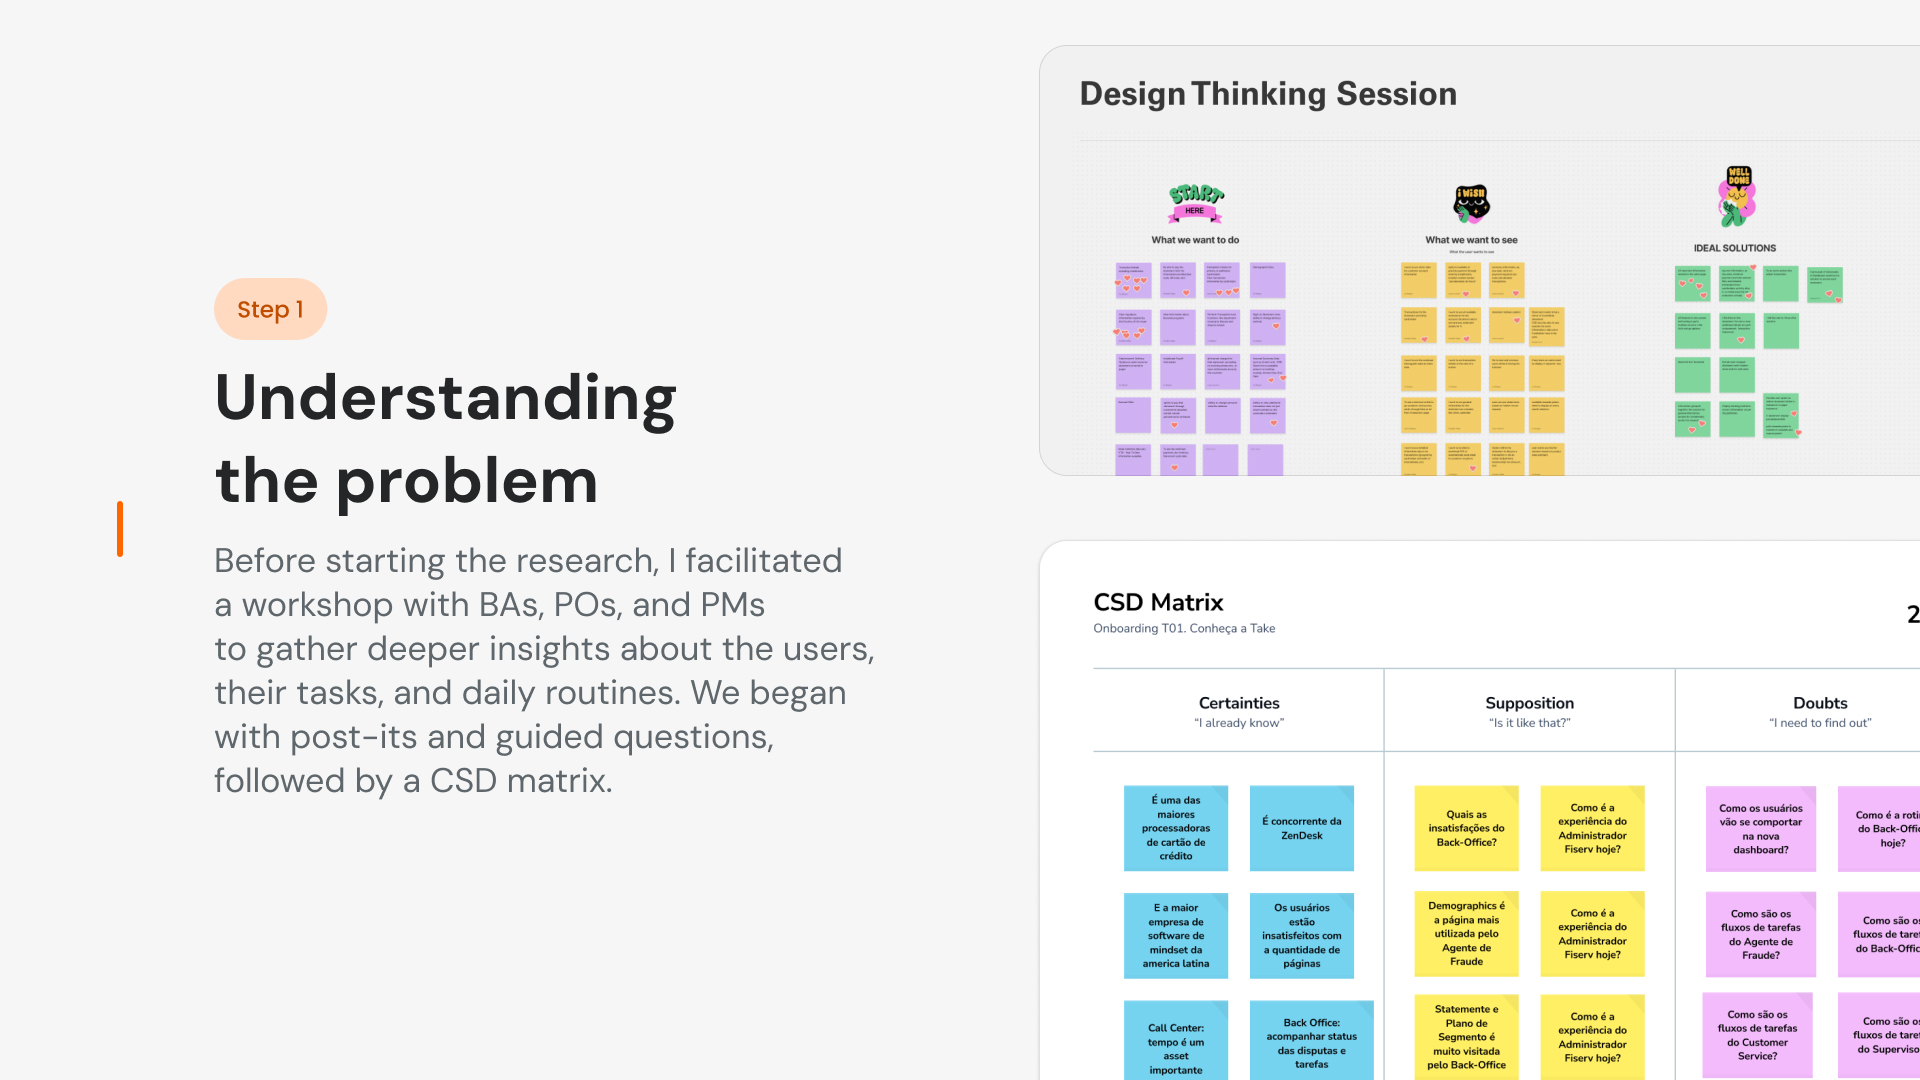
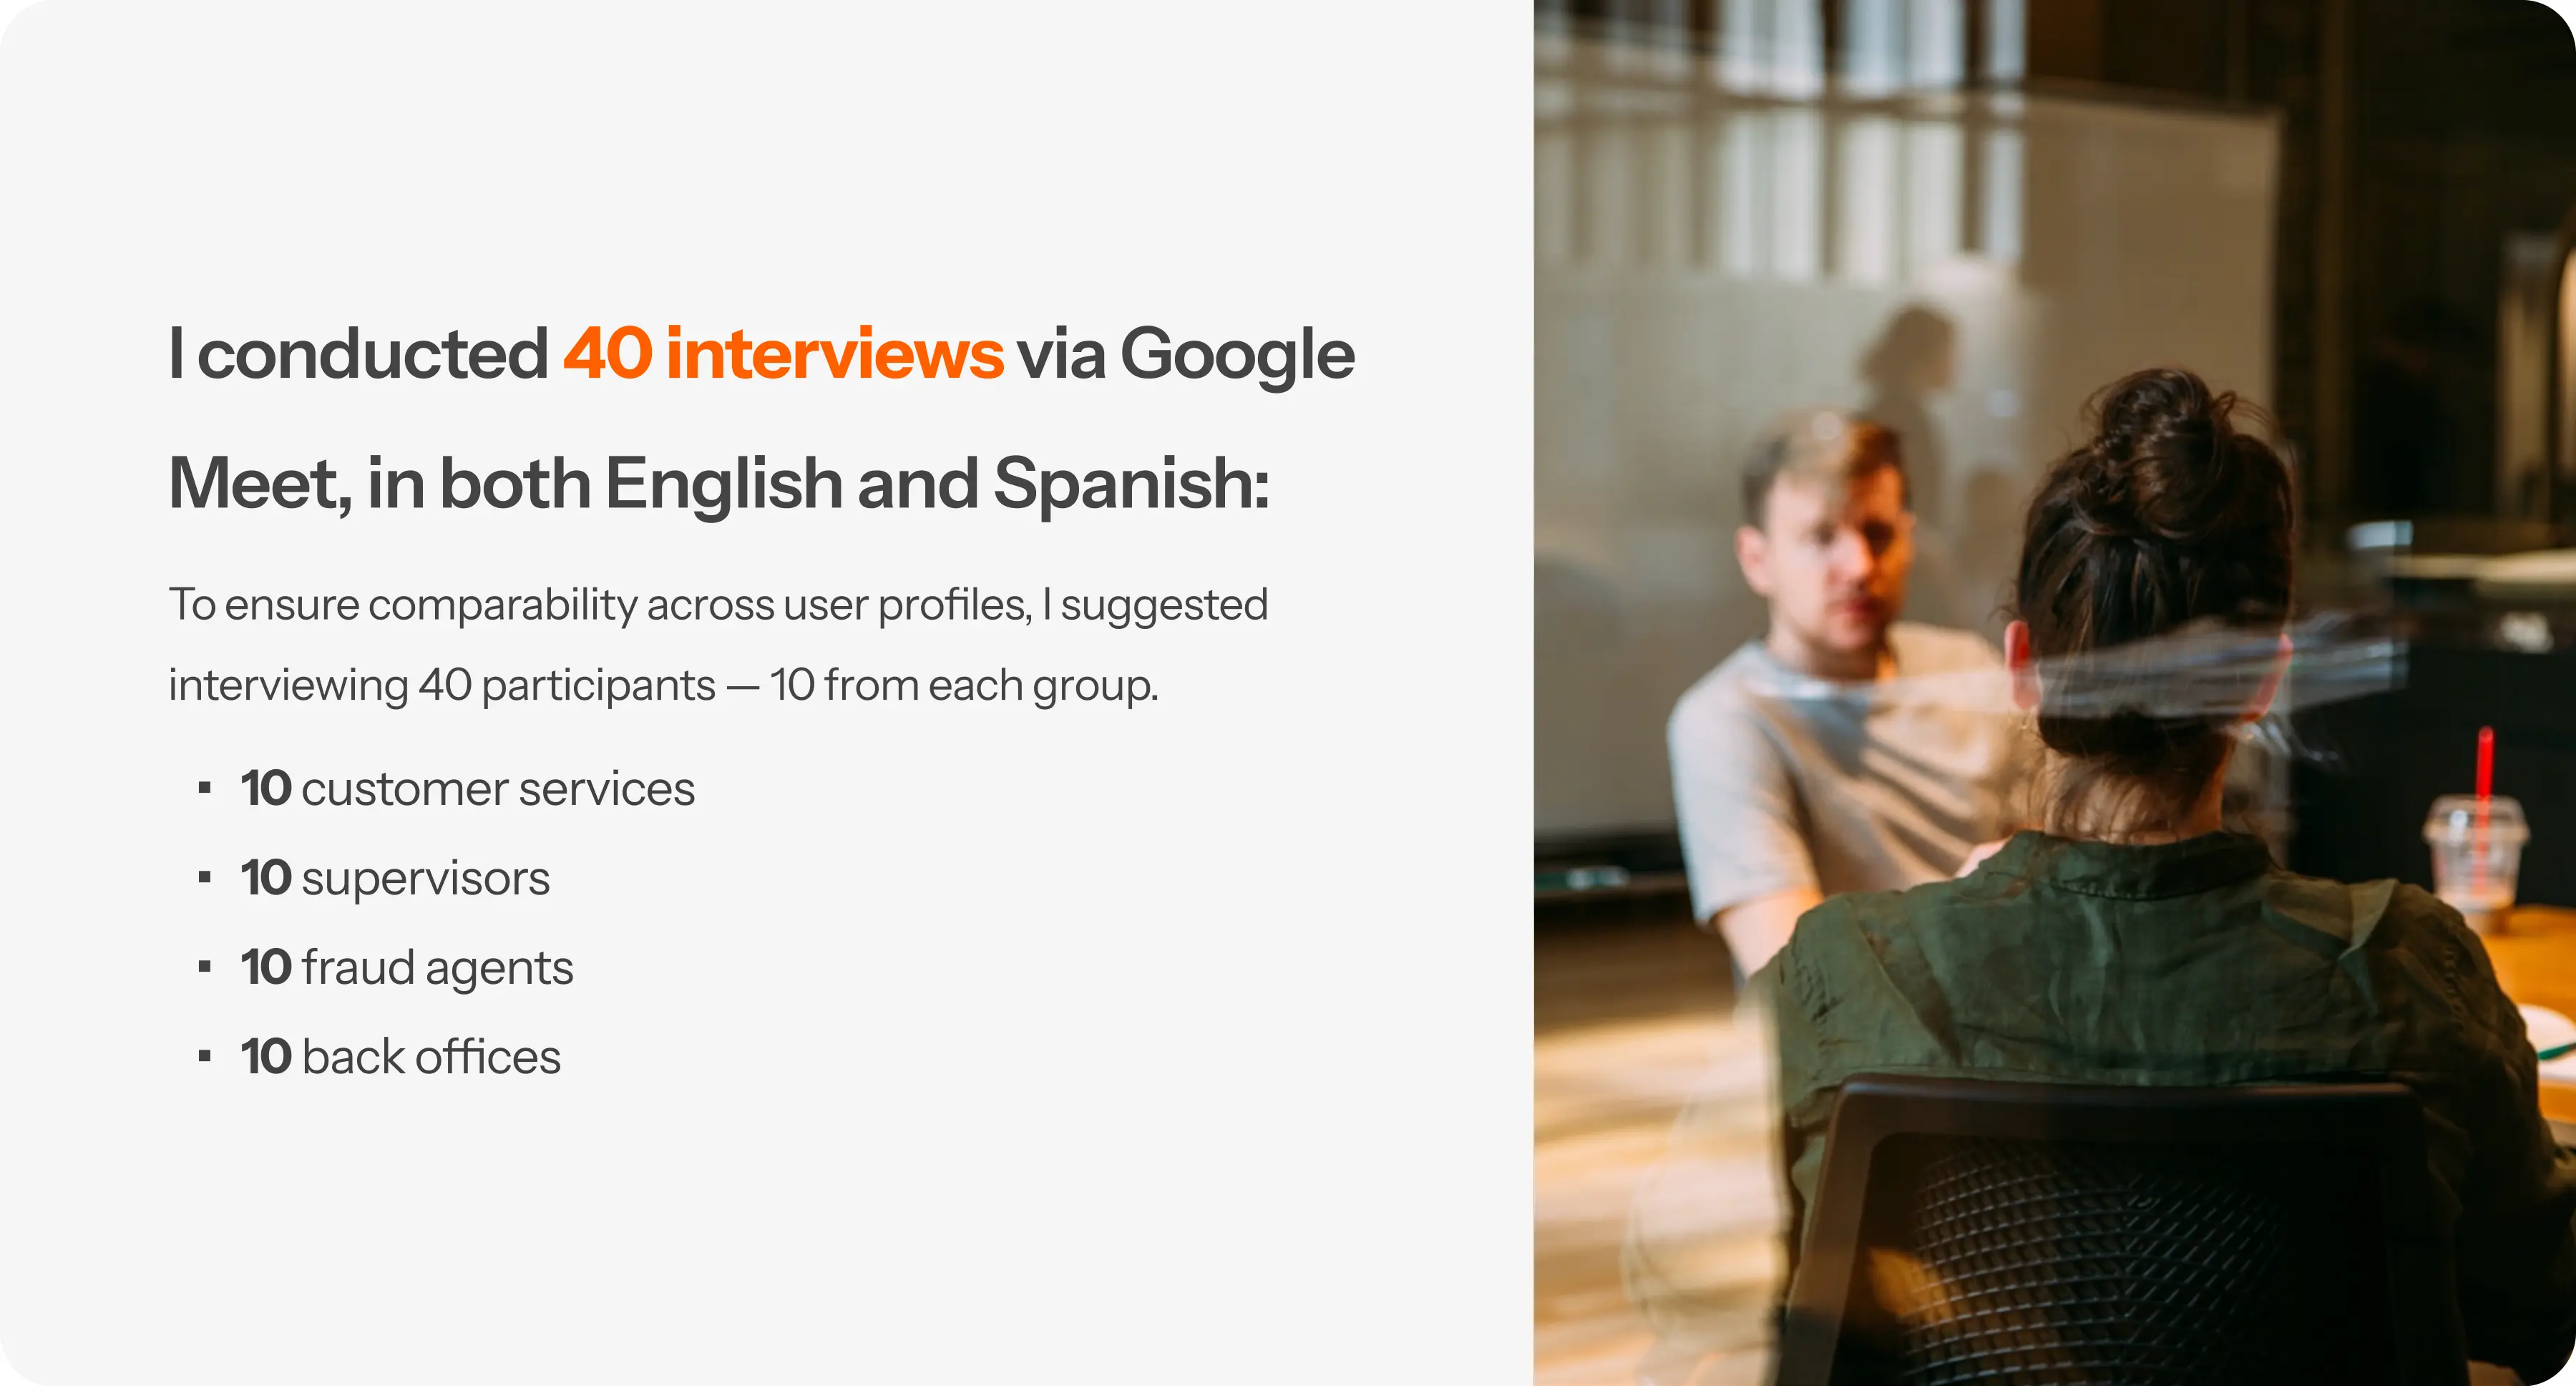
User Research steps 🔍
This stage involved:
- Defining the research plan with participant profile, interview script and hypothesis.
- PO had recruiting users;
- Interview and analyze data;
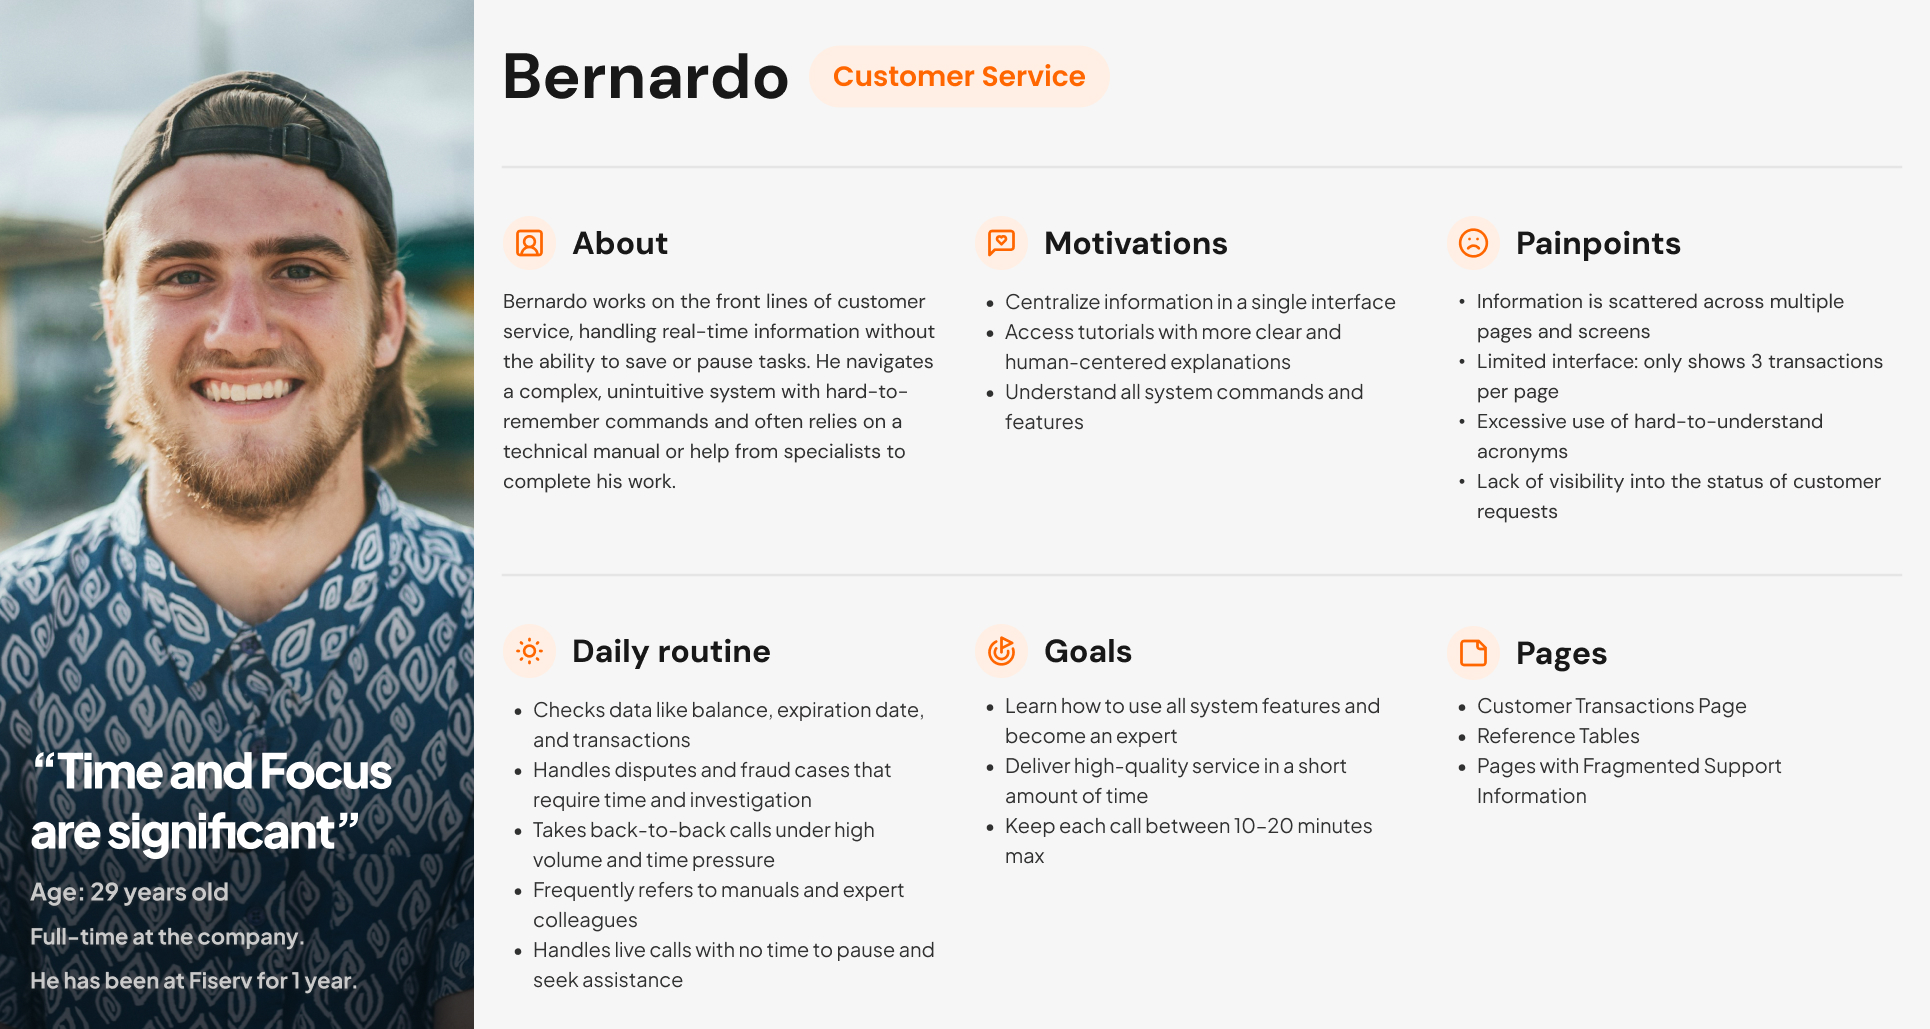
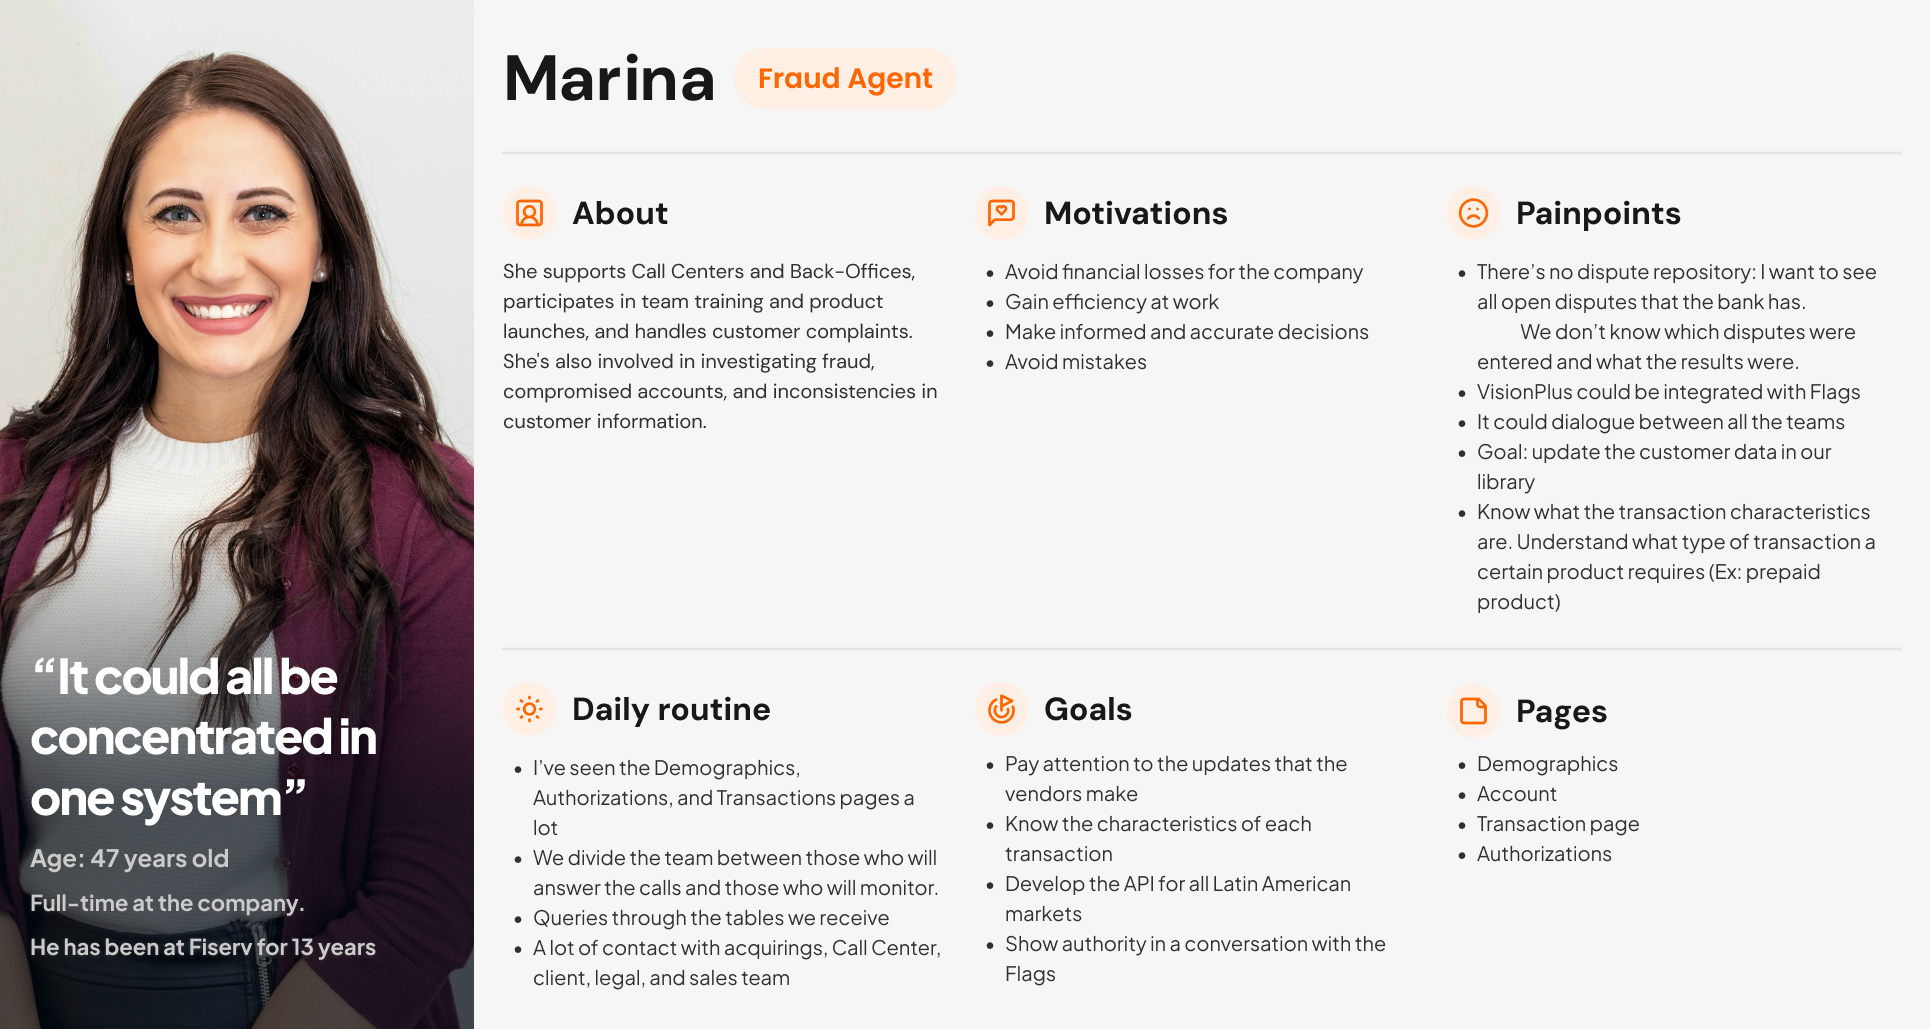
- Synthesizing it into a Persona Document; and presenting the results visually to the team.
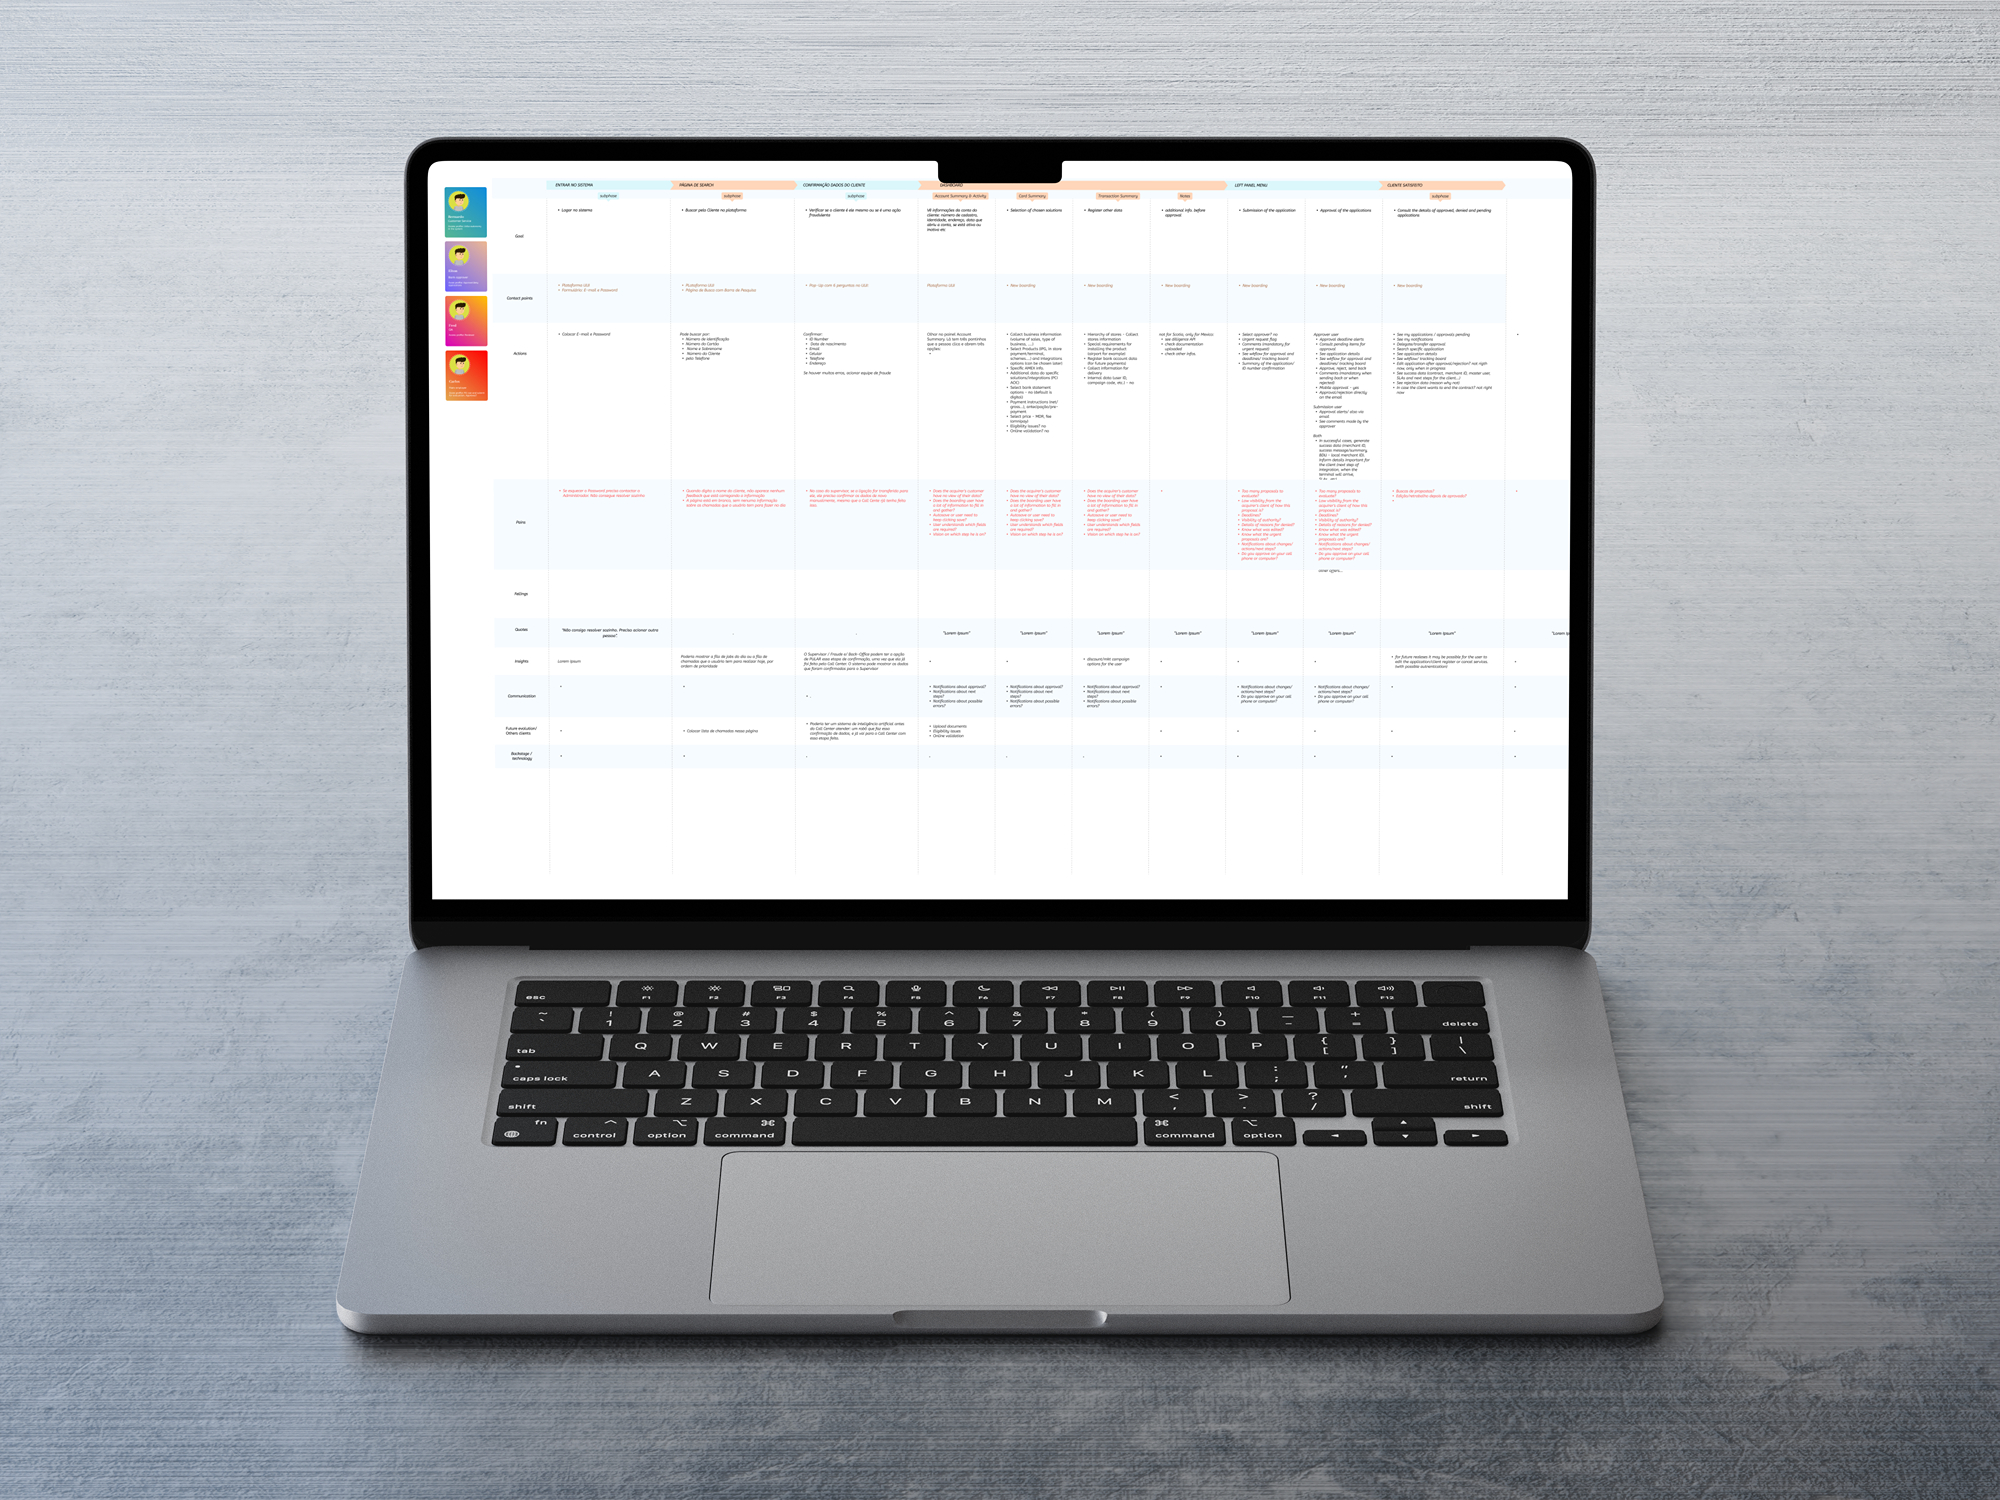
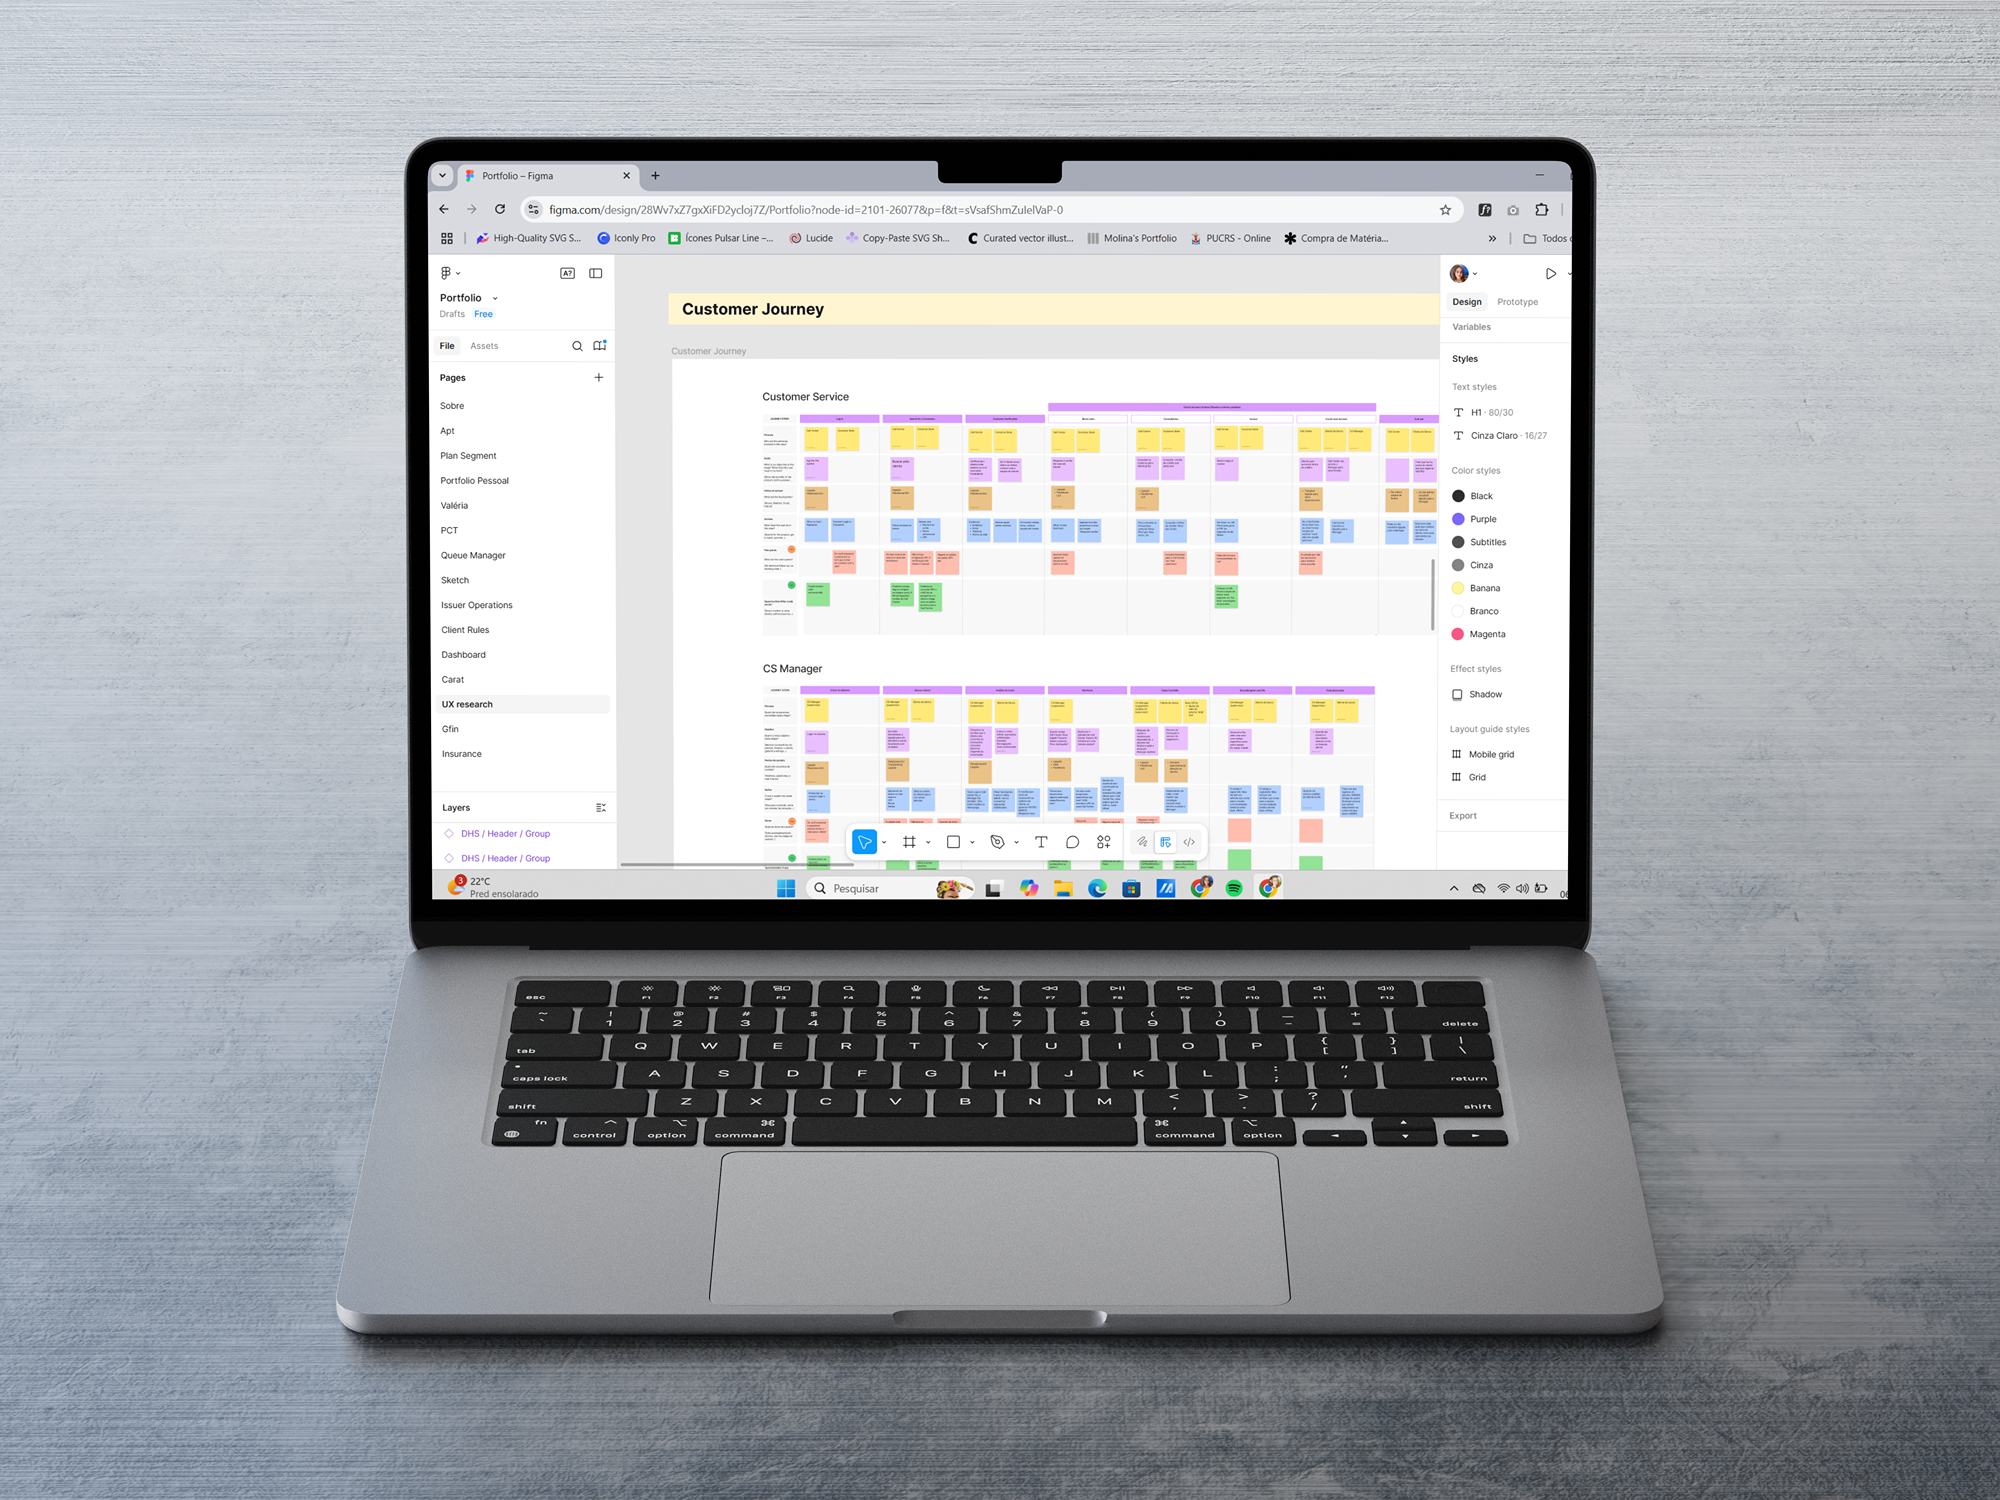
Customer Journey, Userflows and Sitemap
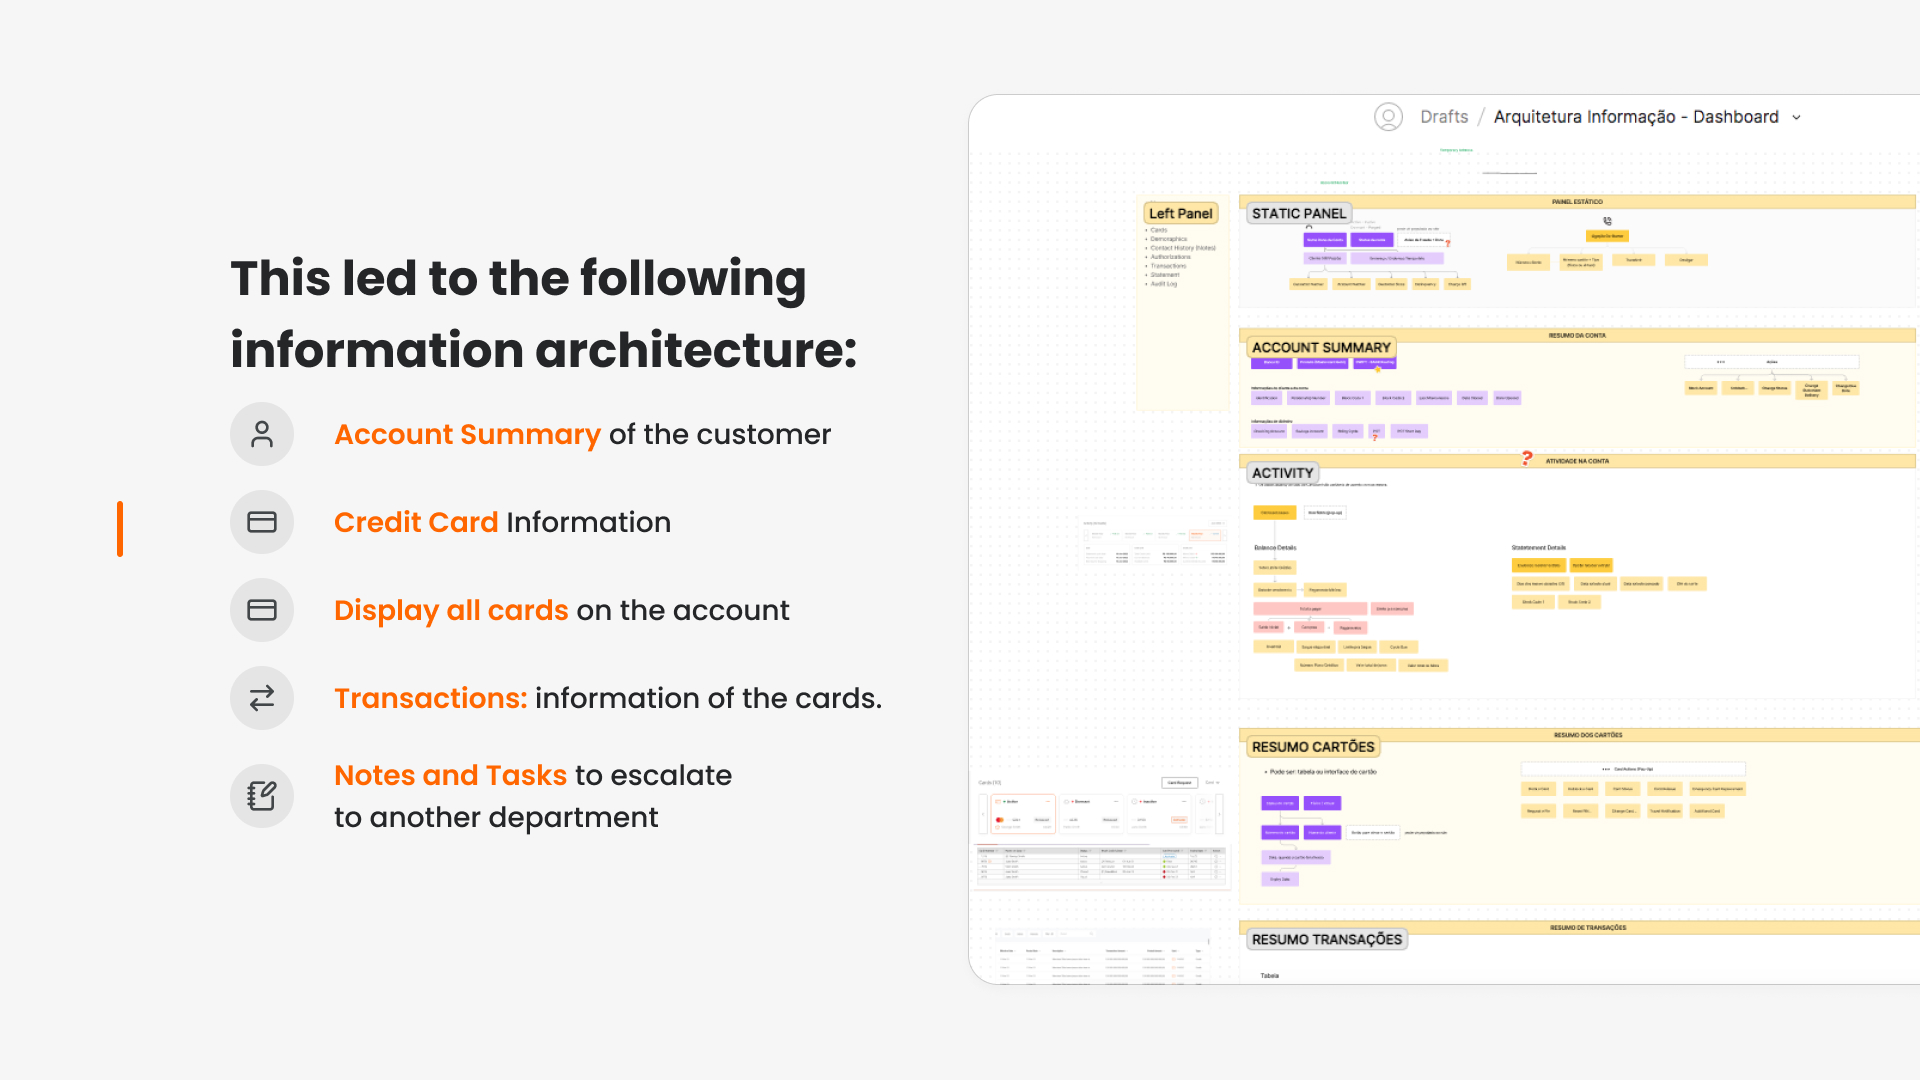
After that, I mapped the journey, user flow, and key tasks for each persona. Finally, I ran a card sorting exercise with the compiled information and worked on defining the information architecture.
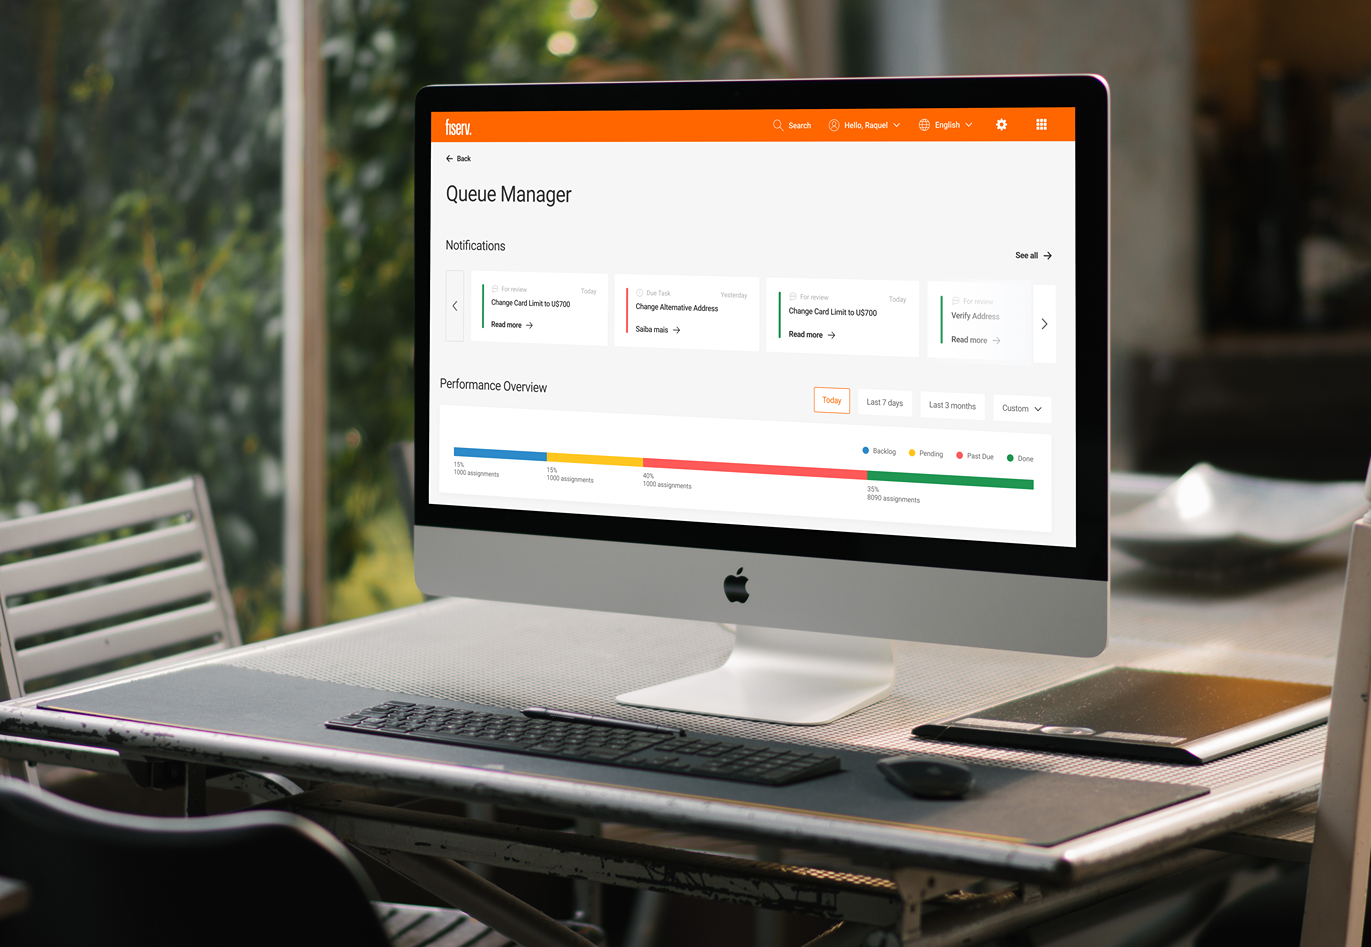
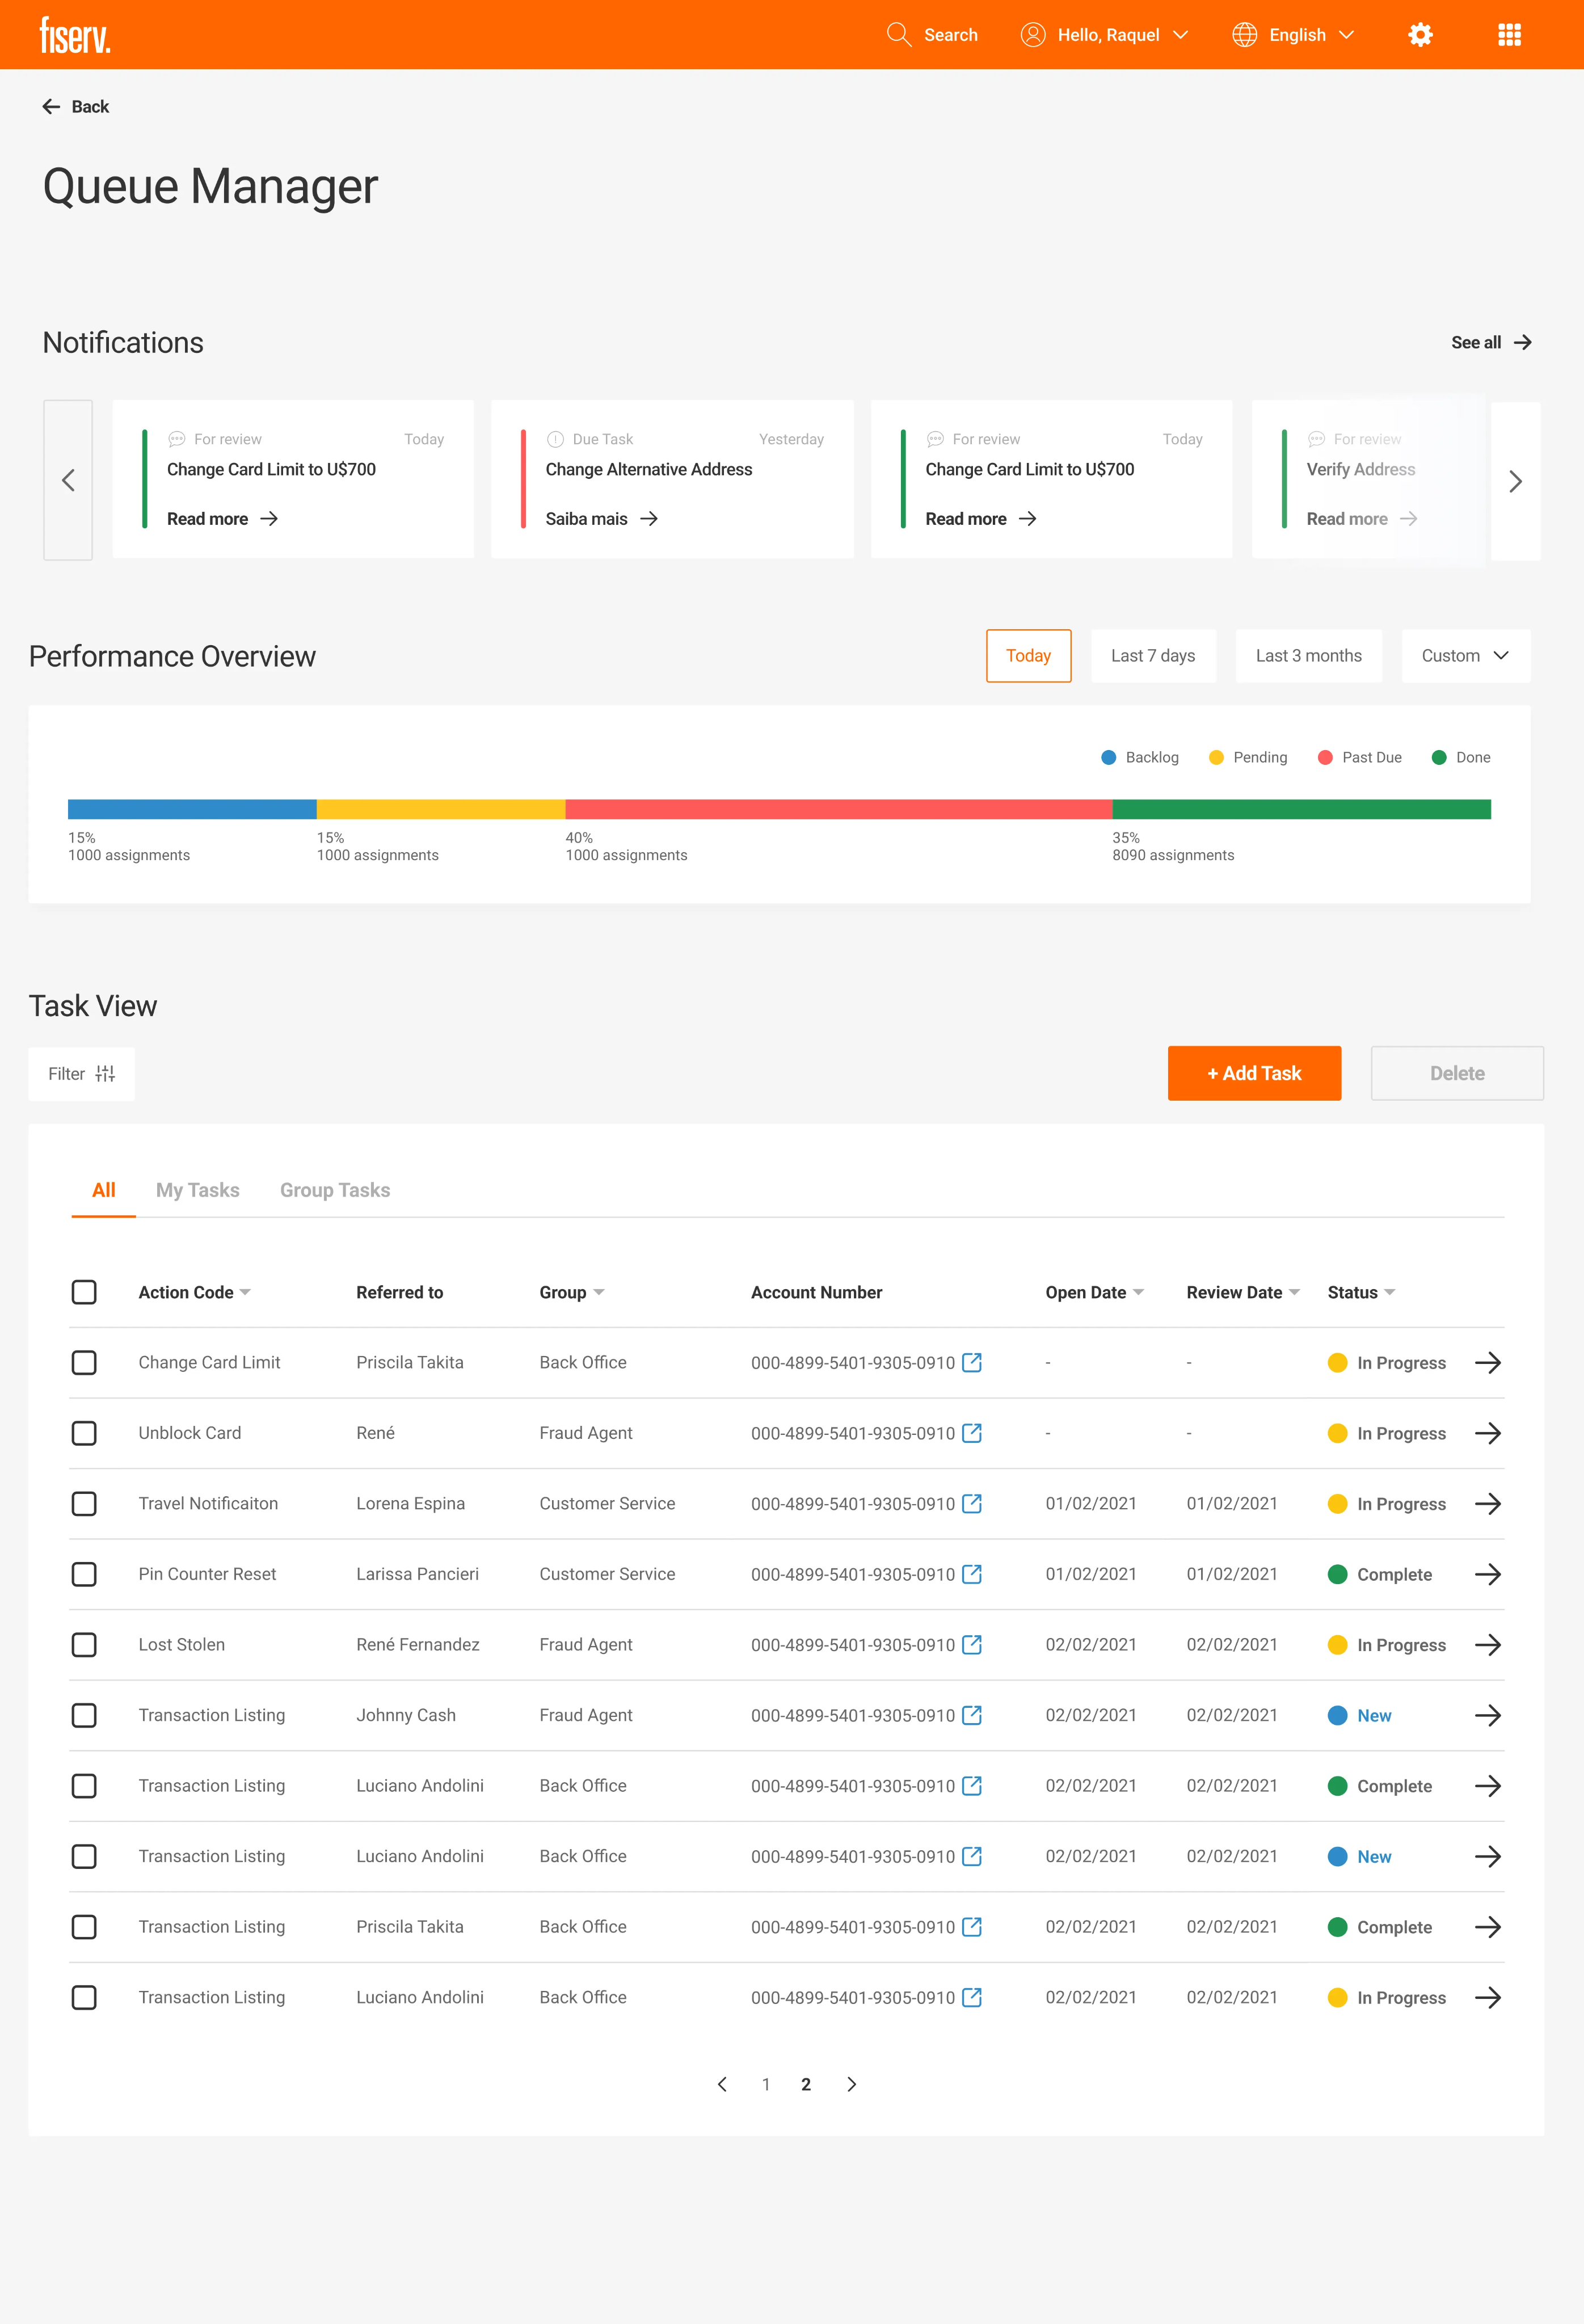
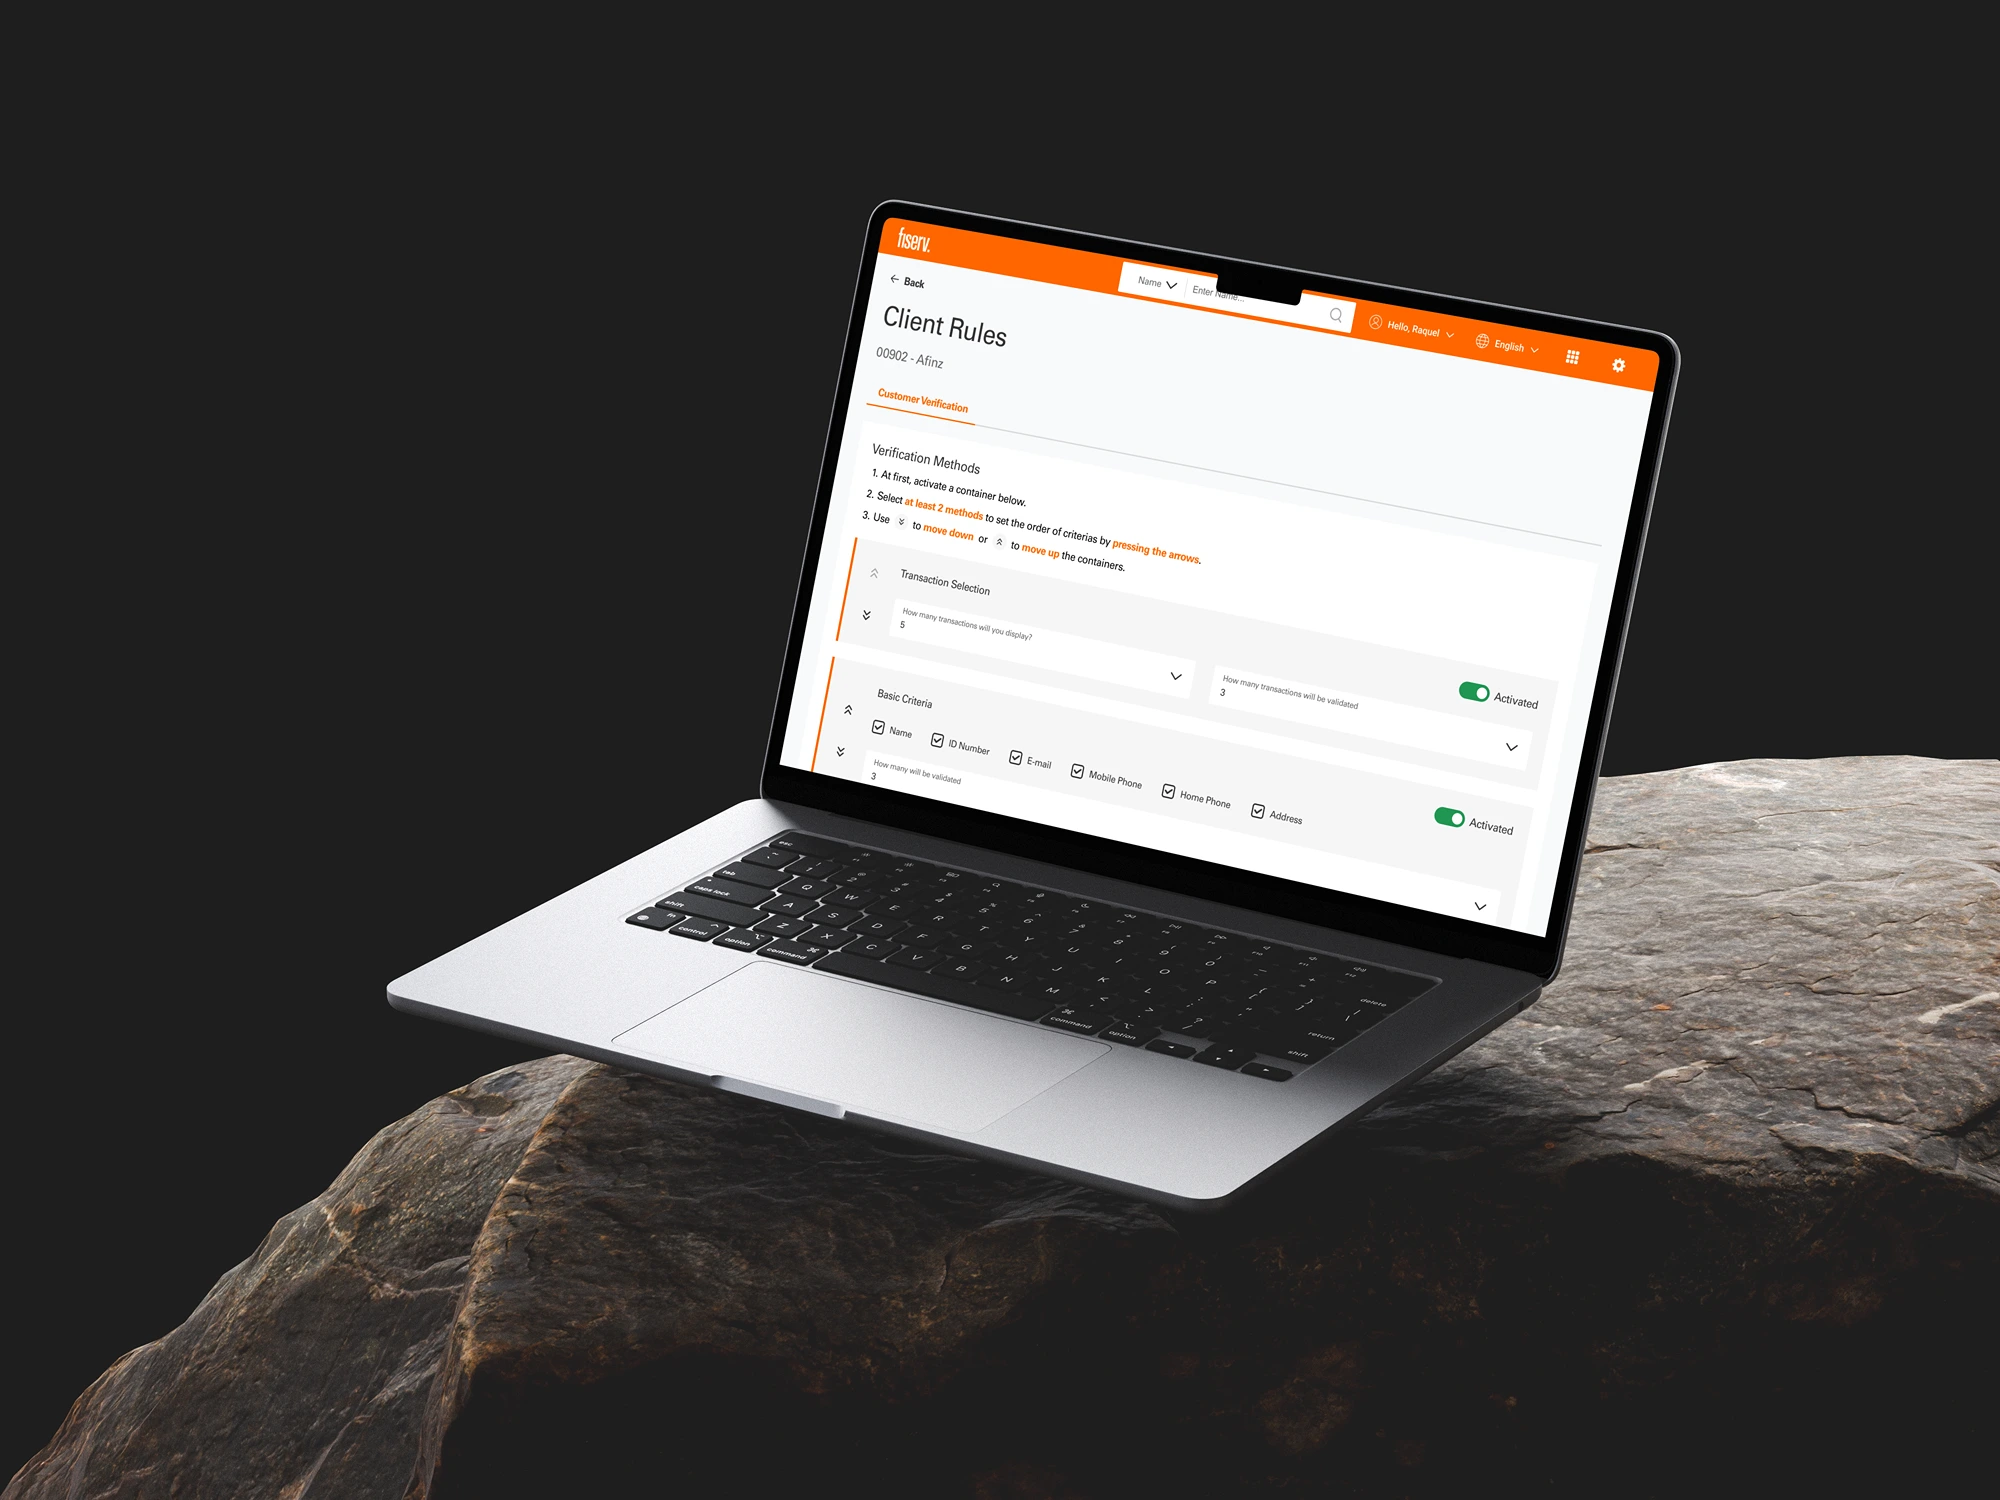
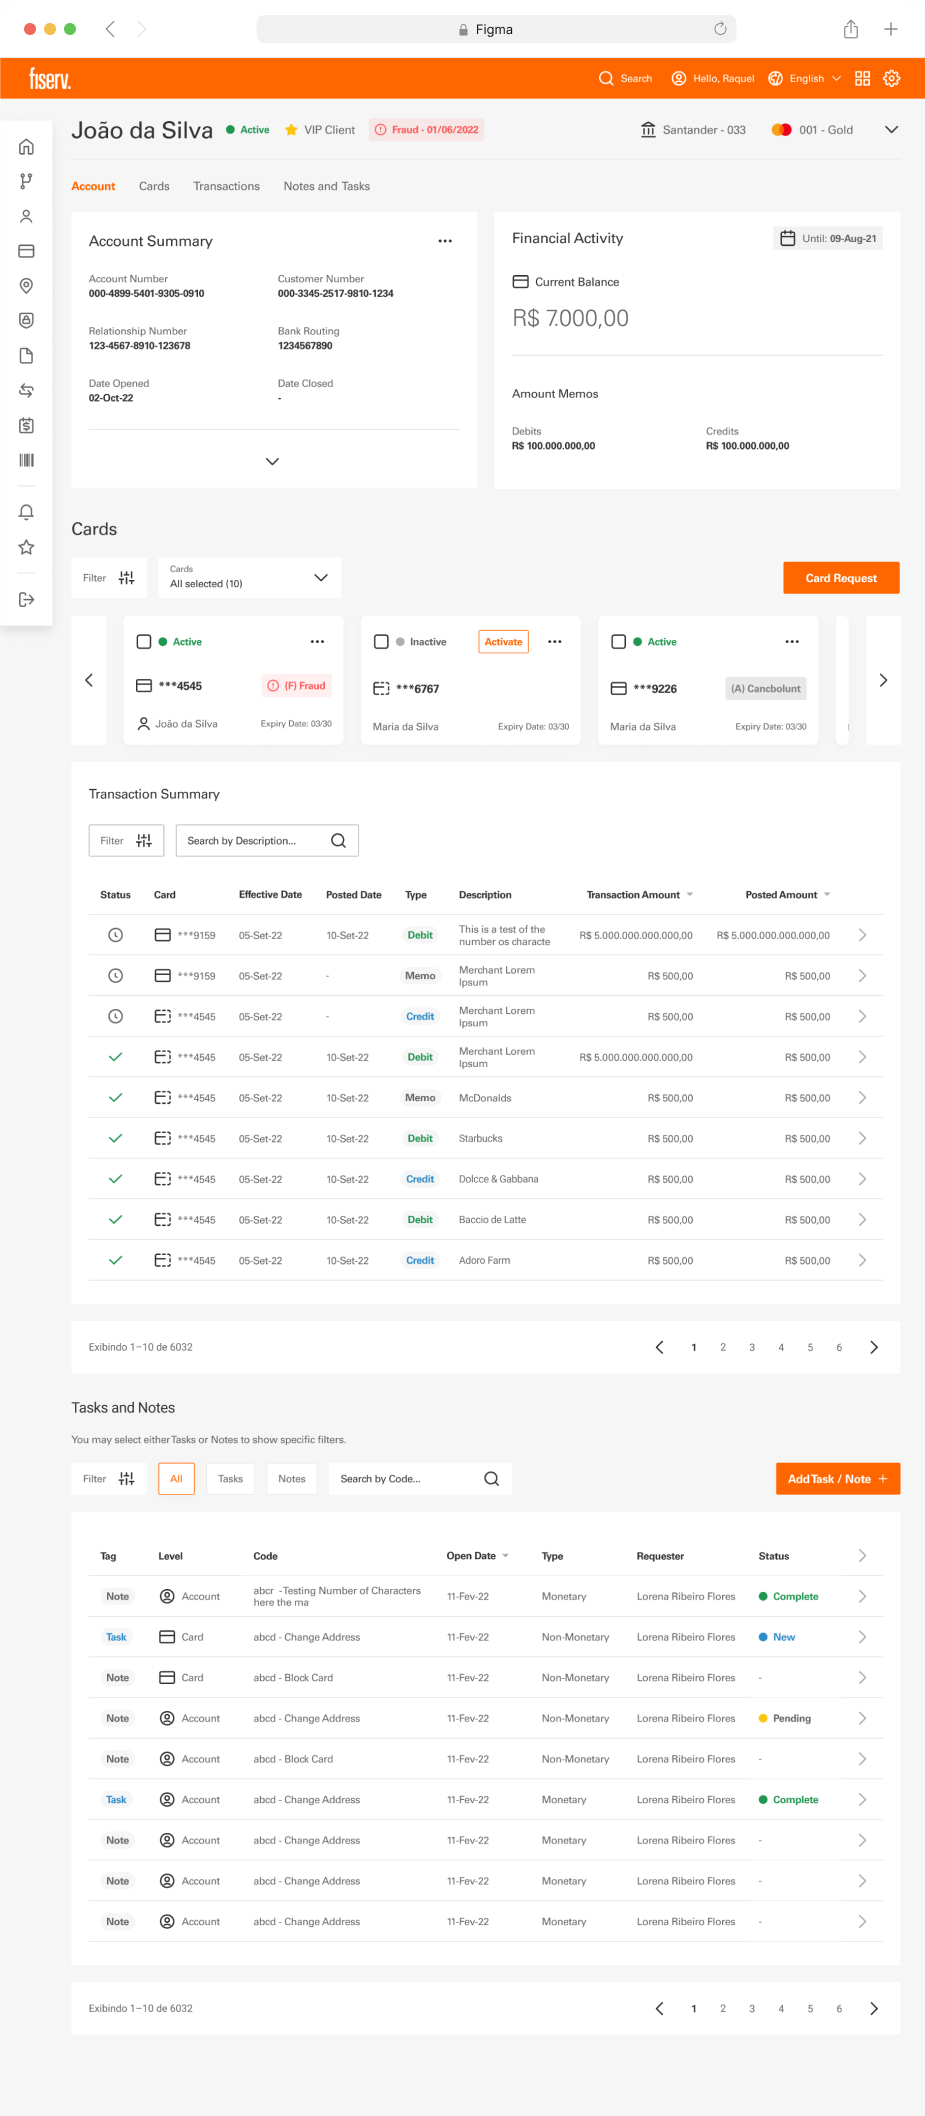
Action: features and screens
The insights gathered from the research helped shape the main features we saw as most important to our users. I was responsible for some of the project's major features, including the Dashboard, Queue Manager, Issuer Operations, Client Rules, PCT, Plan Segment, Insurance, among others.